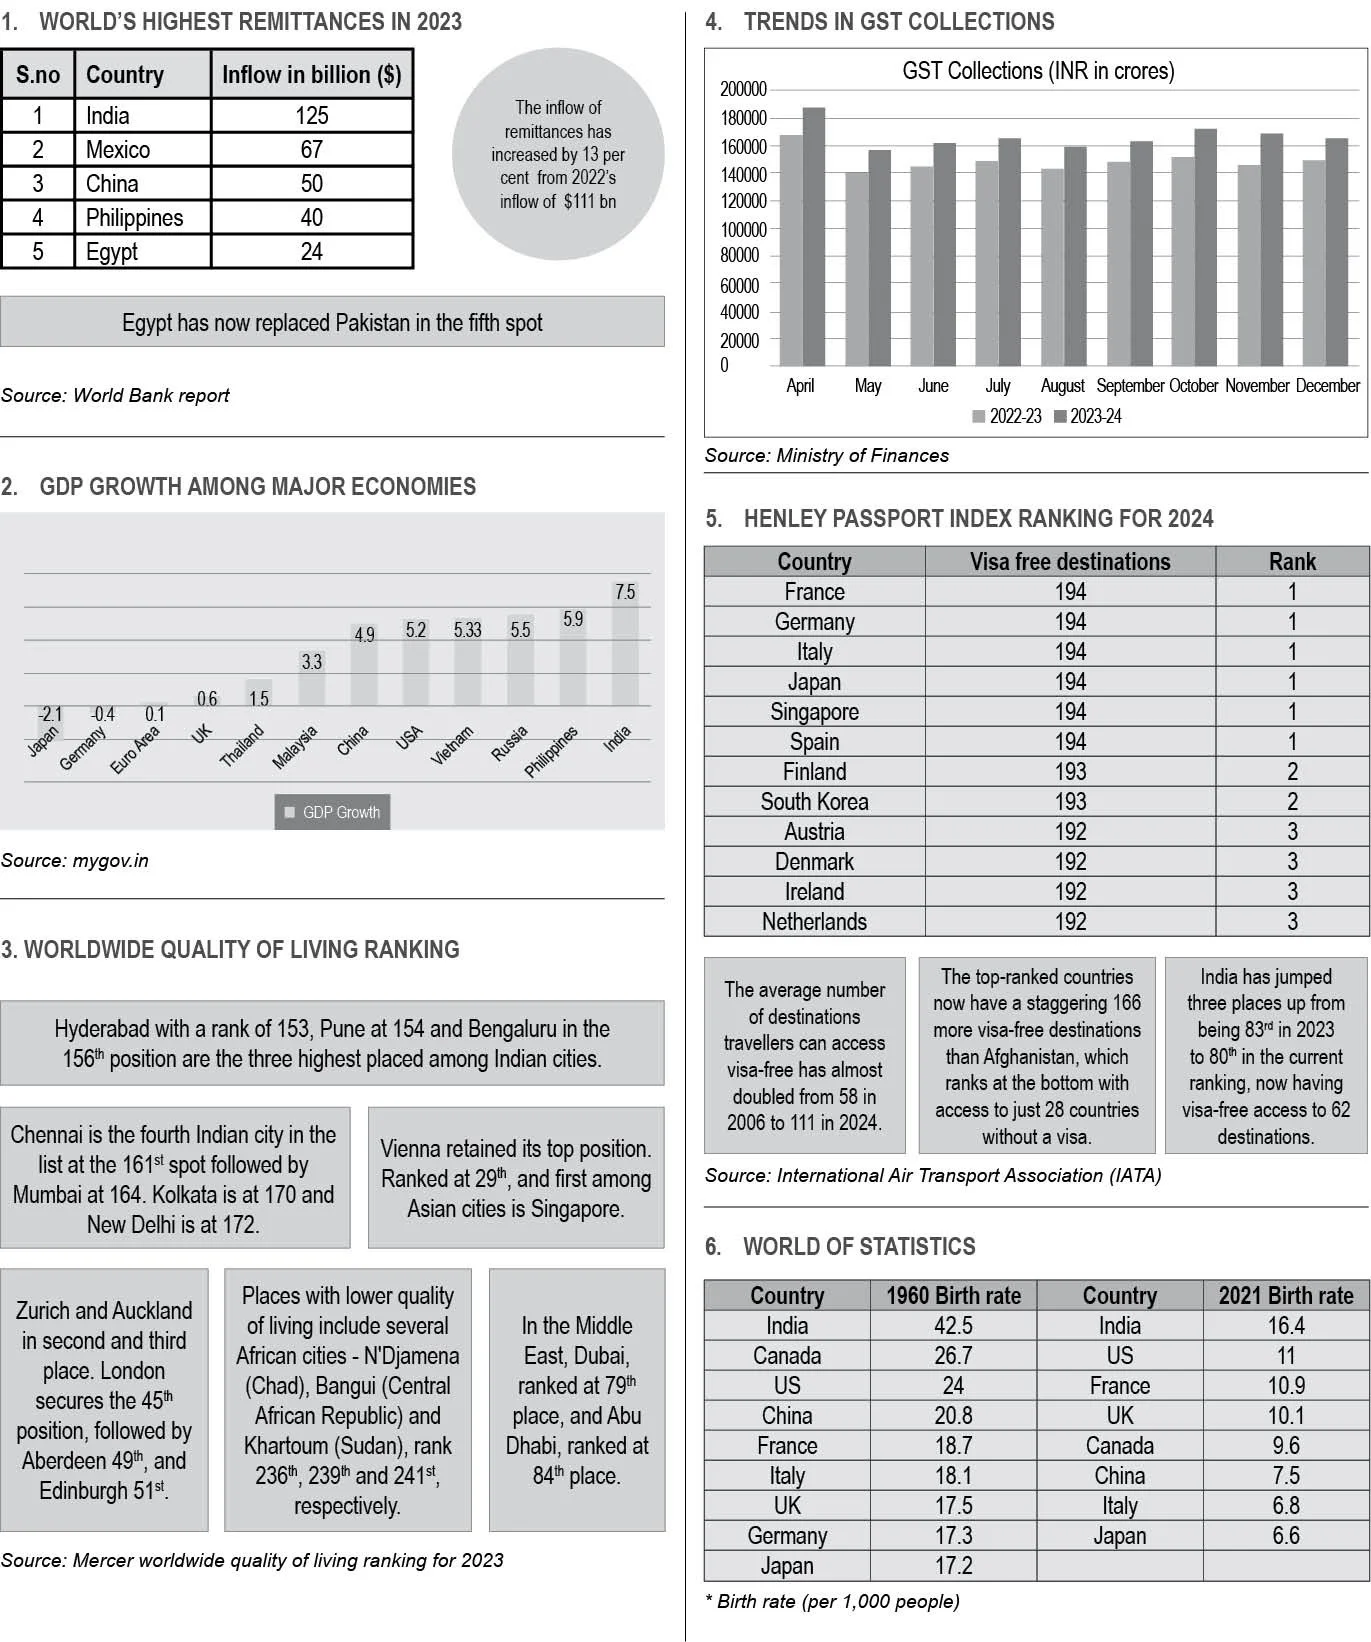
1. INDIA’S ADVERTISING SPEND OUTLOOK
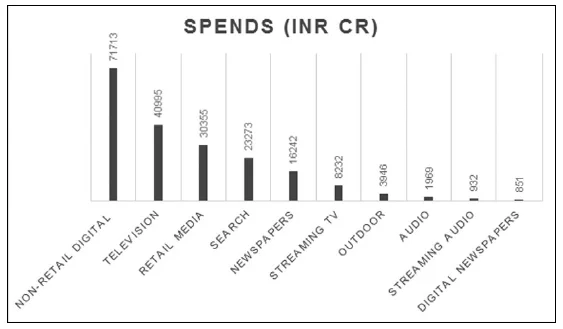
Source: WPP Media Company (formerly GroupM)
2. INDIA’S CURRENT POPULATION
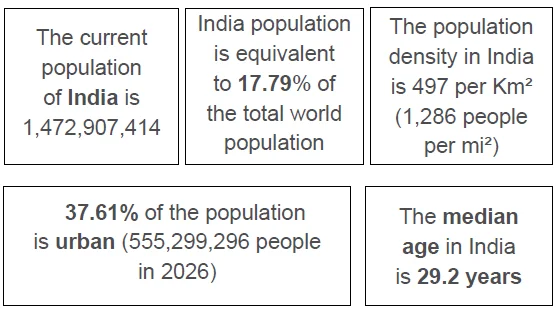
Source: Worldometer
3. MOST SPOKEN LANGUAGES ONLINE AND OFFLINE
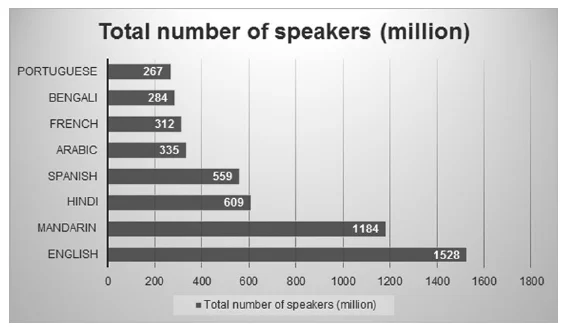
Source: Data Reportal, Ethnologue
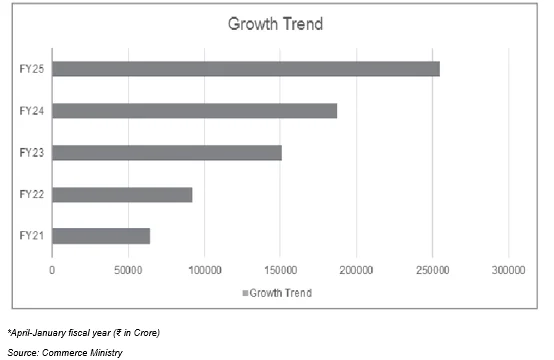
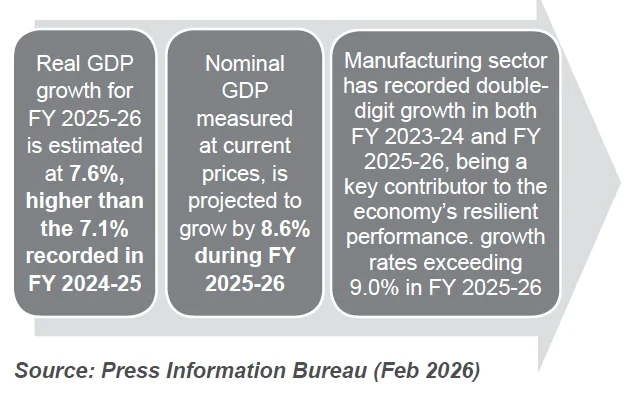
4. INDIA’S GROWING GDP
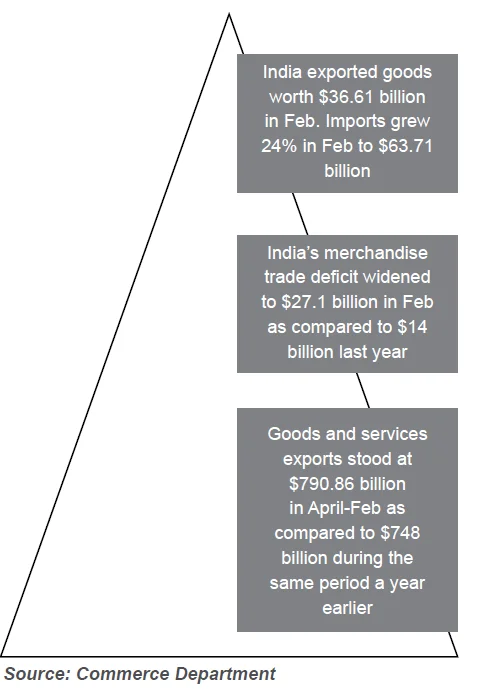
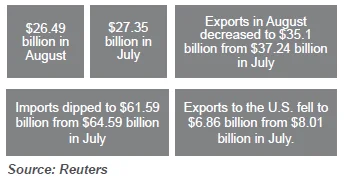
5. TRADE DEFICIT WIDENS
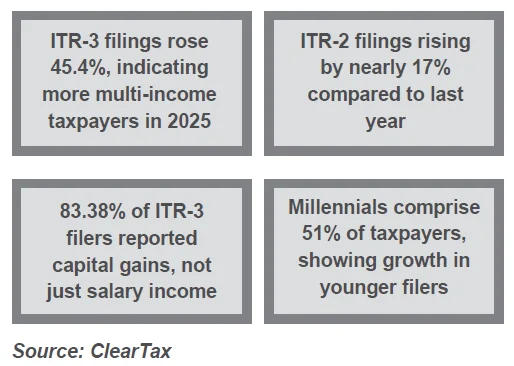
TAX TRENDS IN 2025
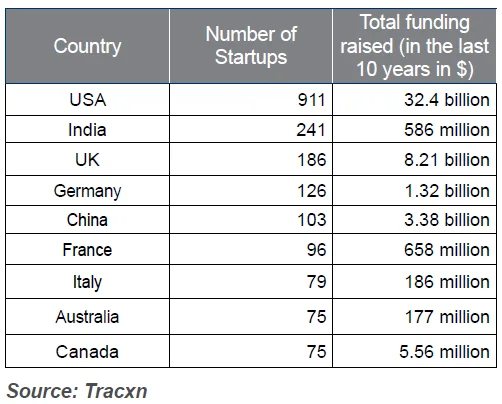
TOP COUNTRIES WITH SPACE TECH STARTUPS
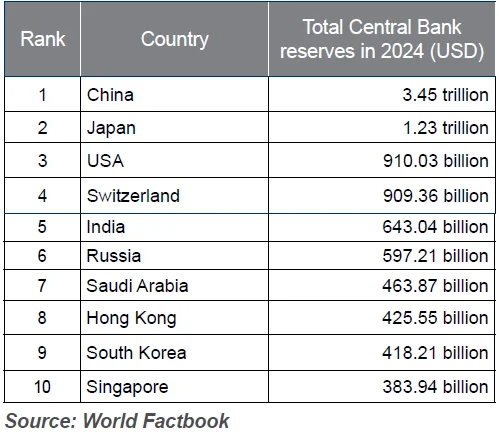
COUNTRIES WITH THE LARGEST FOREIGN EXCHANGE RESERVES
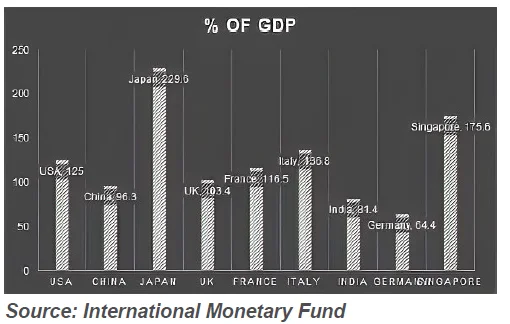
HIGHEST NATIONAL DEBT 2025 AS A PERCENTAGE OF GDP
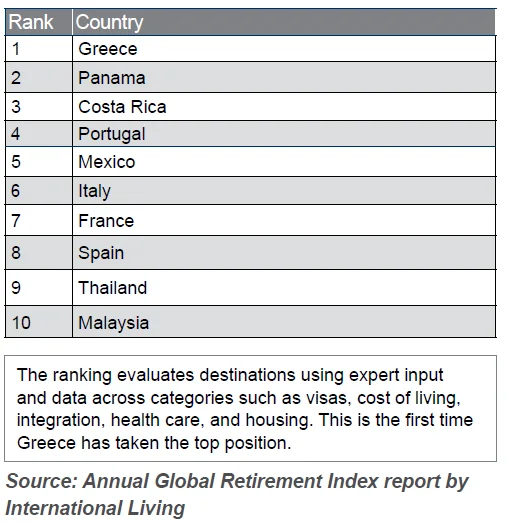
BEST PLACES TO RETIRE IN 2026
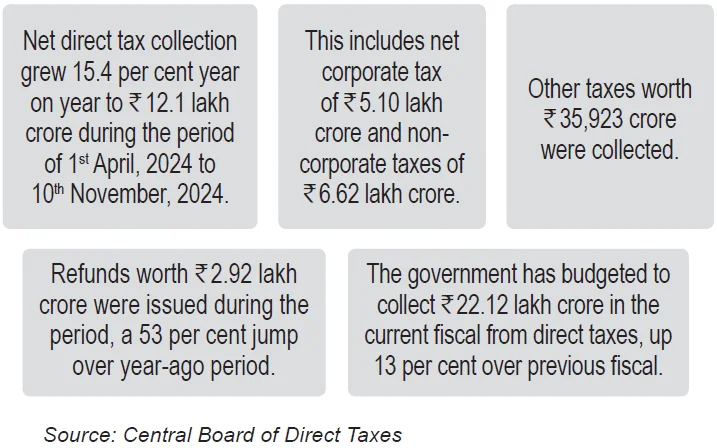
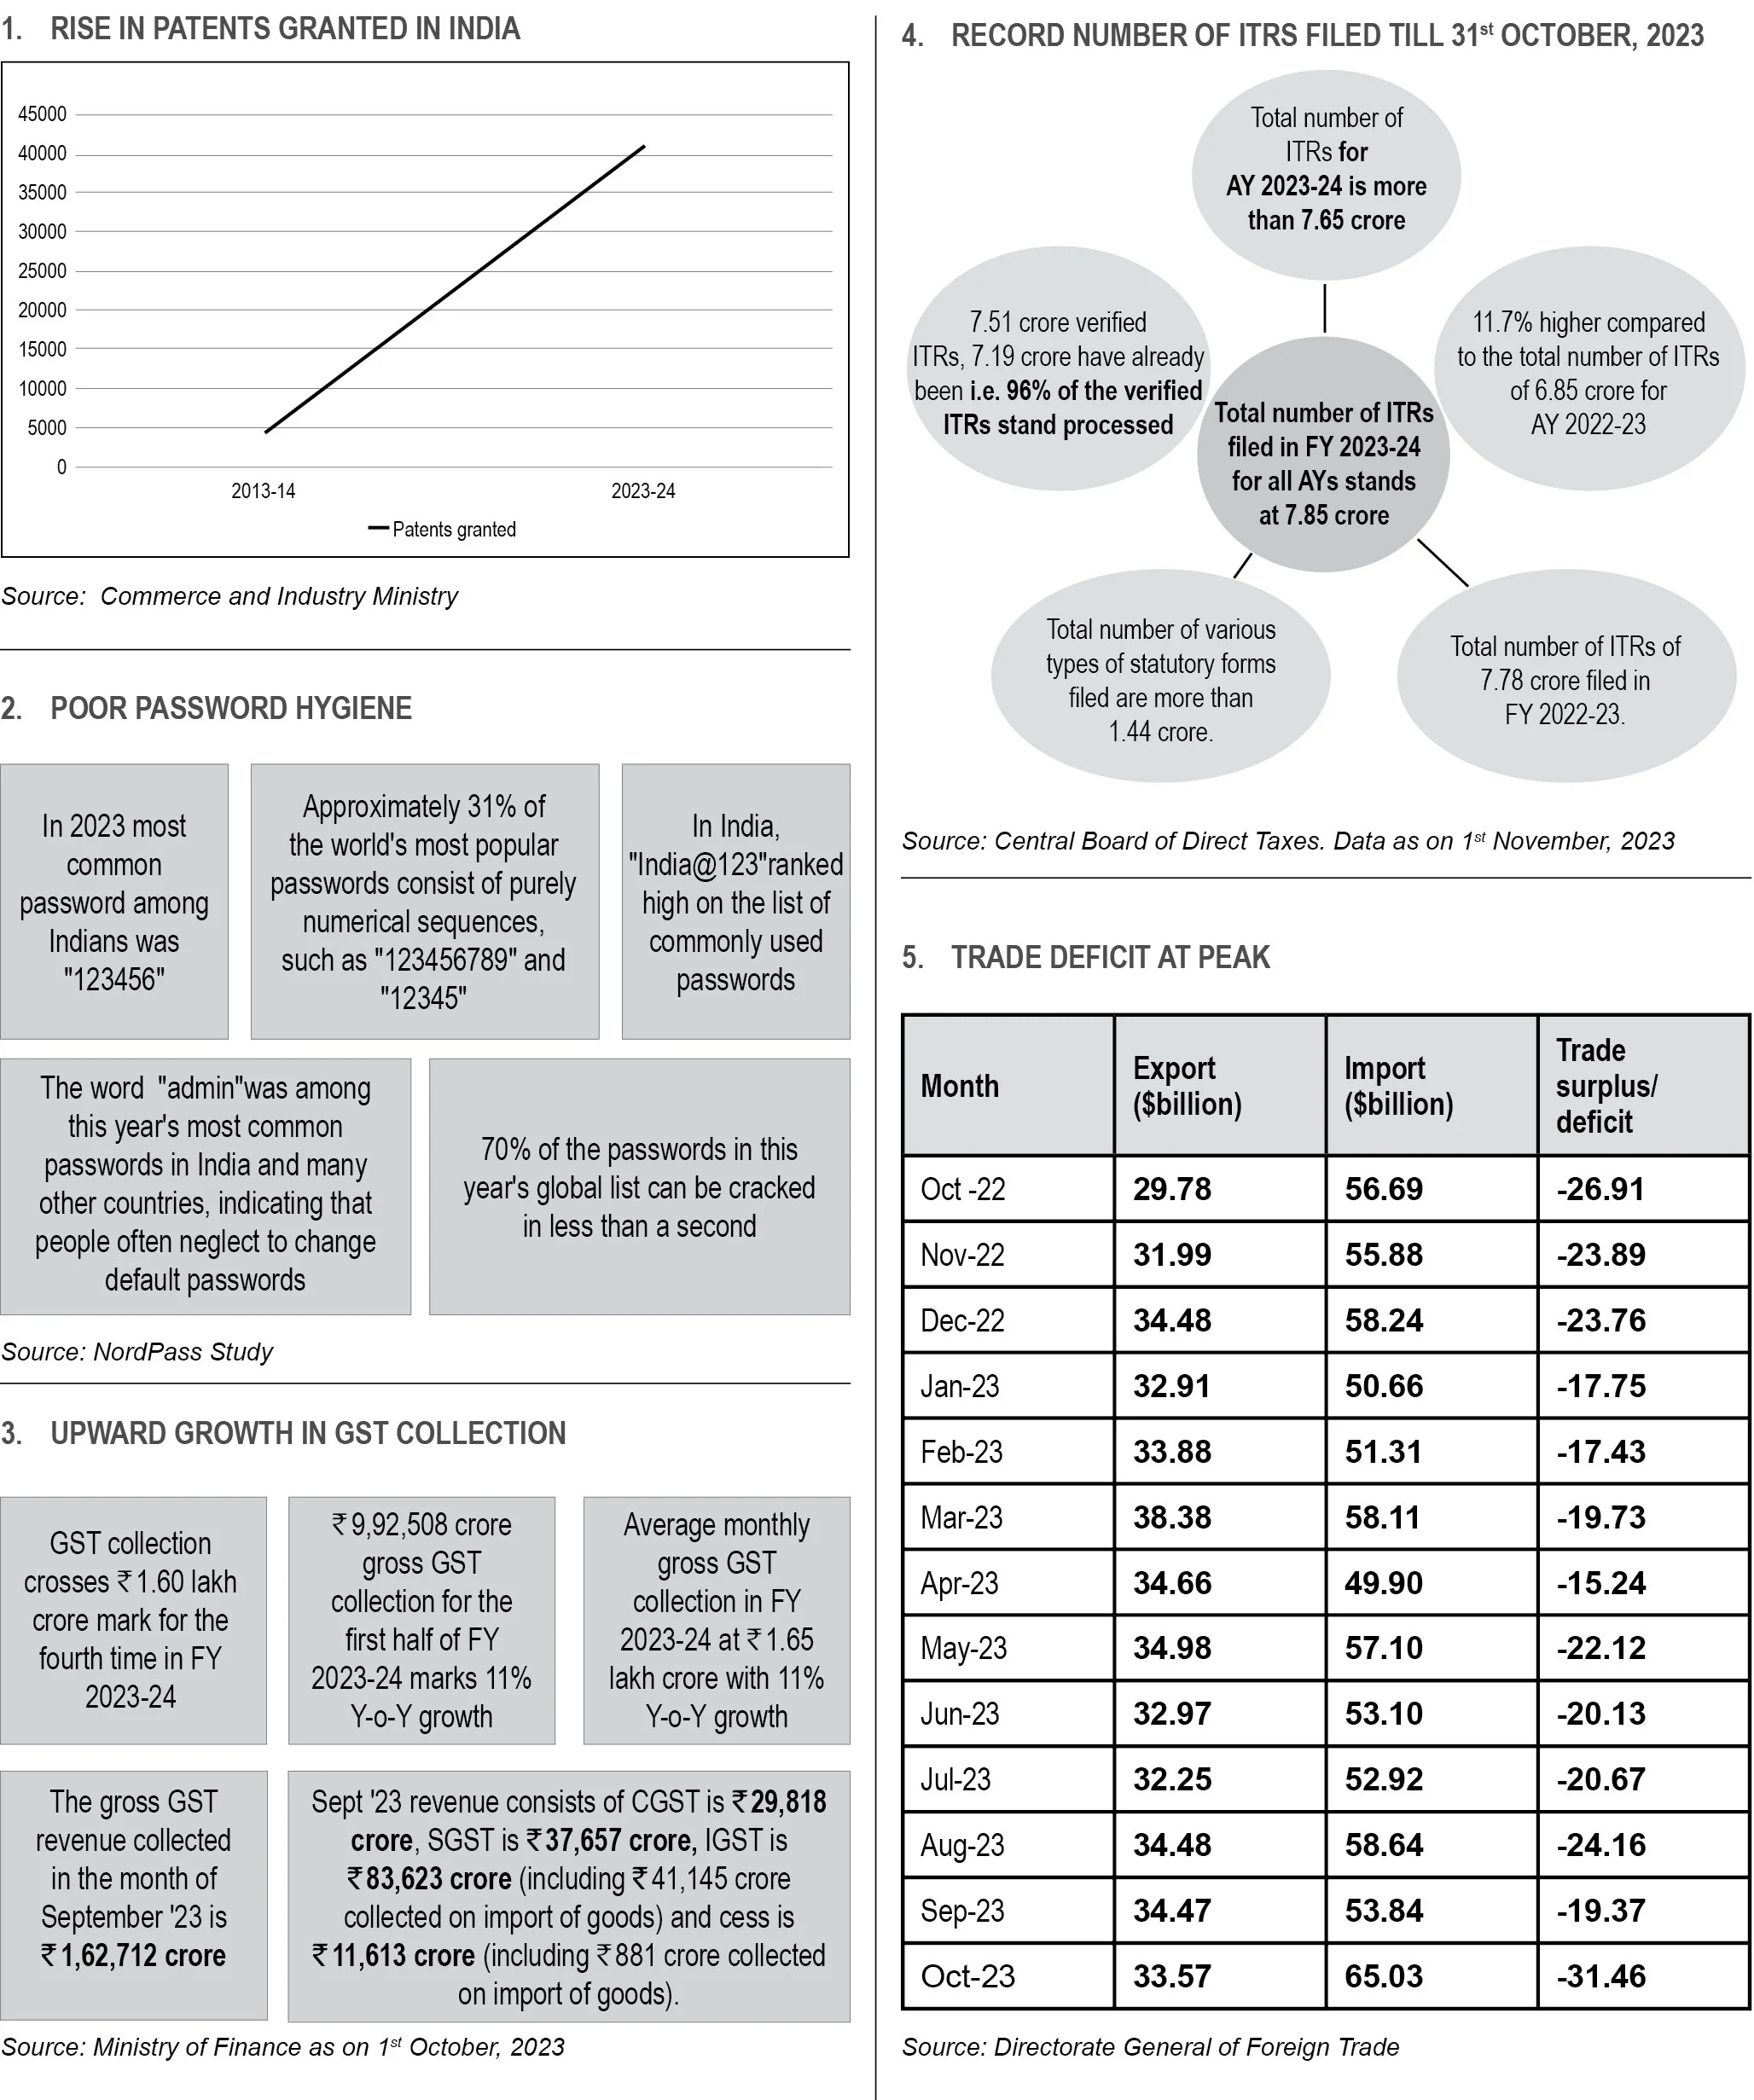
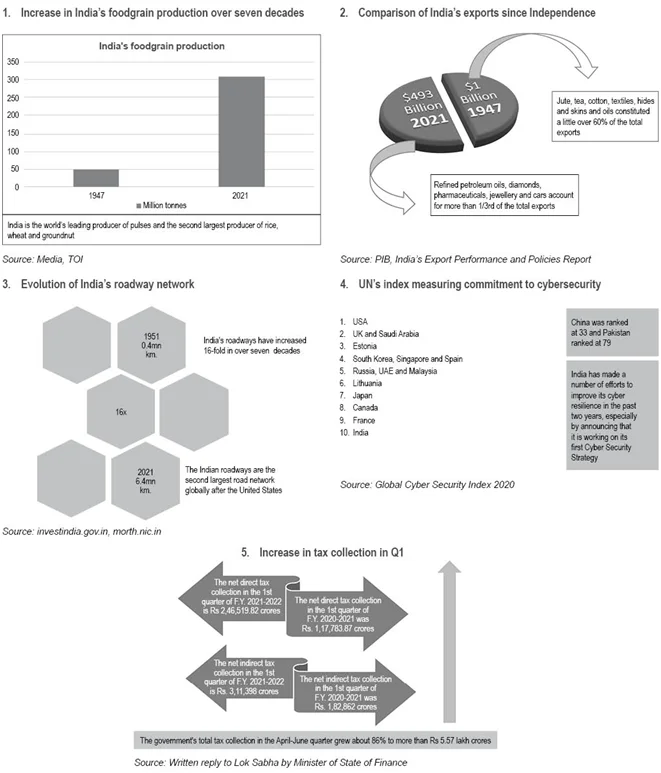
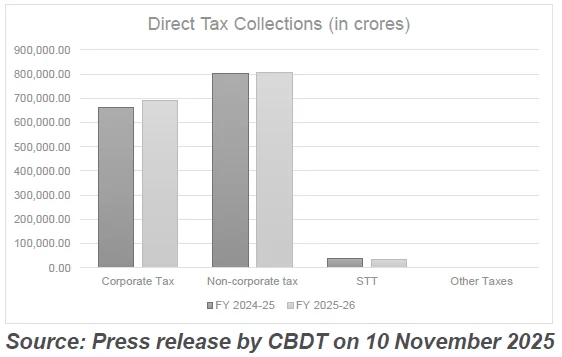
1. DIRECT TAX COLLECTIONS FOR FY 2025-26
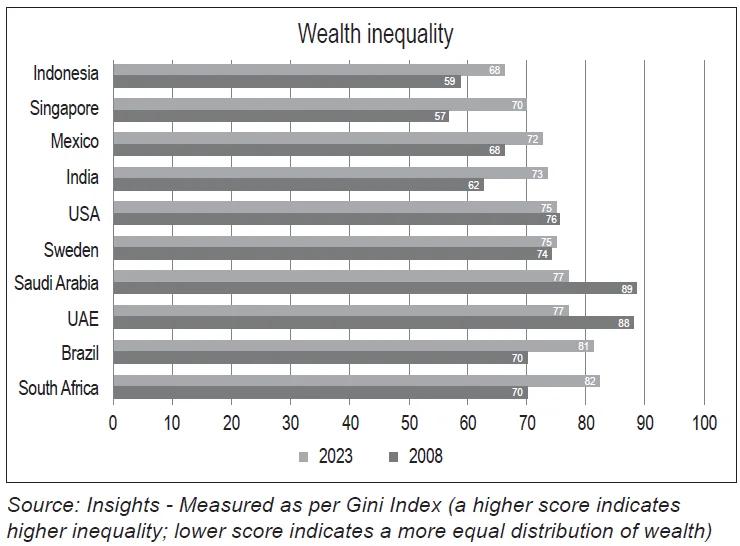
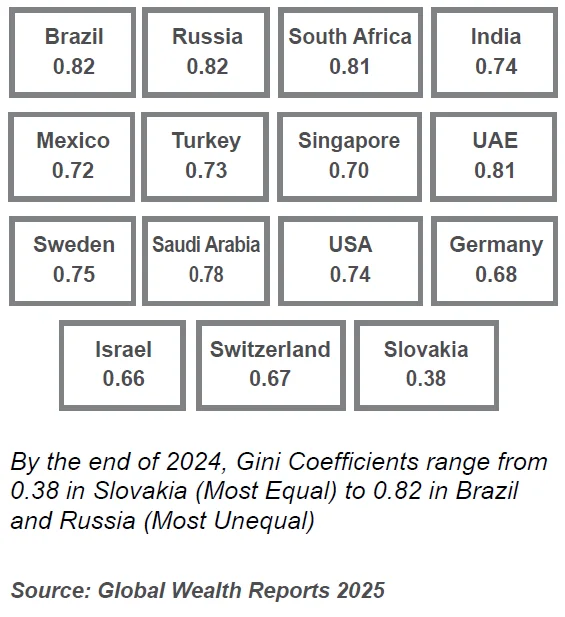
2. GLOBAL WEALTH INEQUALITY MEASURED BY GINI COEFFICIENT
3. IPOs TREND IN FY 2025
| Particulars |
Q4 FY25 |
Q3 FY25 |
Q2 FY25 |
Q1 FY25 |
| No. of IPOs |
11 |
30 |
26 |
13 |
| Total funds raised * |
165 |
955 |
344 |
166 |
Average
issue size* |
15 |
32 |
13 |
13 |
| Average total oversubscription (in times) |
105 |
50 |
81 |
70 |
| Average listing day gain/(loss) % |
17% |
28% |
34% |
33% |
| Money raised by PE backed IPOs |
99 billion raised by 3 companies |
174 billion raised by 5 companies |
180 billion raised by 7 companies |
109 billion raised by 7 companies |
| Total funds raised through Offer For Sale |
147 billion
(58% of total funds) |
643 billion (51% of total funds) |
185 billion (45% of total funds) |
120 billion (58% of total funds) |
Source: KPMG in India Analysis, 2025 based on final offer documents filed with ROC
4. IPOs IN FY 24 AND FY 25
| Particulars |
FY 25 |
FY 24 |
| No of IPOs |
80 |
76 |
| Total funds raised |
1630 |
619 |
| Average issue size |
20 |
8 |
| Average total oversubscription (in times) |
71 |
50 |
| Average listing day gain/ loss (%) |
29% |
29% |
| Money raised by PE backed IPOs |
562 billion raised by 22 companies |
199 billion raised by 15 companies |
Total funds raised
through OFS |
1095 billion was raised through OFS constituting 51% of total funds |
324 billion was raised through OFS constituting 42% of total funds |
Source: KPMG in India Analysis, 2025 based on final offer documents filed with ROC
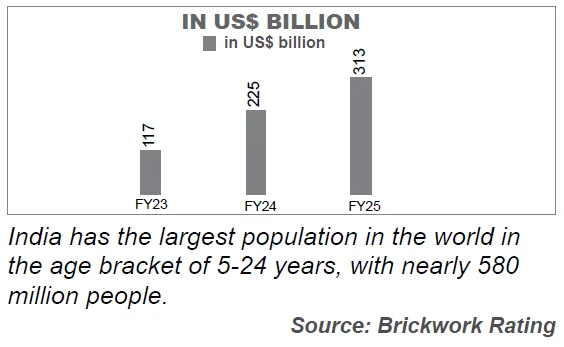
5. EDUCATION INDUSTRY IN INDIA
1.1. INDIA’S TRADE DEFICIT NARROWS
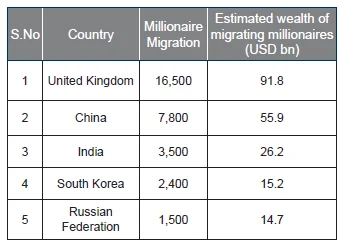
2. COUNTRIES THAT LOST THE MOST MILLIONAIRES IN 2025
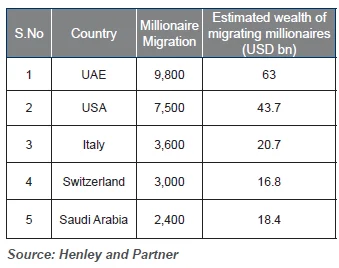
3. COUNTRIES THAT GAINED THE MOST MILLIONAIRES IN 2025
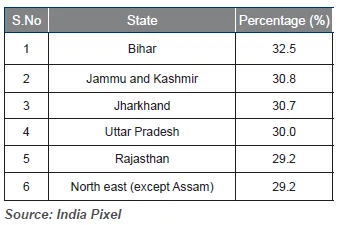
4. INDIAN STATES WITH THE LARGEST GEN-Z POPULATION
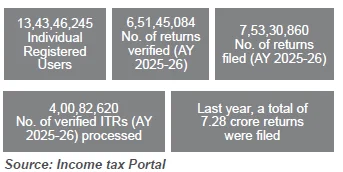
5. INCOME TAX RETURNS HIT NEW RECORD
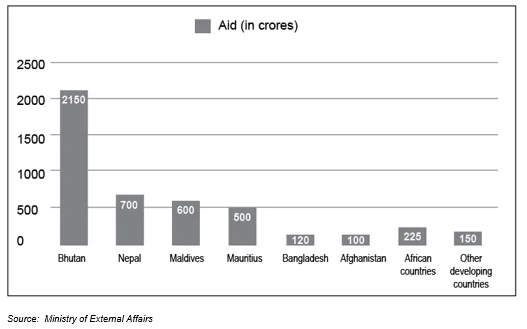
1. COUNTRIES WHICH RECEIVED THE MOST MONEY FROM INDIA IN BUDGET 2025-26
2. POWERFUL PASSPORTS IN THE WORLD
| Rank |
Country |
Visa free destinations |
| 1 |
Singapore |
195 |
| 2 |
Japan |
193 |
| 3 |
Finland |
192 |
| 3 |
France |
192 |
| 3 |
Germany |
192 |
| 3 |
Italy |
192 |
| 3 |
South Korea |
192 |
| 3 |
Spain |
192 |
| 4 |
Austria |
191 |
| 4 |
Denmark |
191 |
| India has dropped five places in this year’s rankings, falling from 80th to 85th.
The Indian passport now provides visa-free access to 57 countries |
| U.S. passport has fallen to ninth place. Currently, U.S. passport holders enjoy visa-free access to 186 destinations. |
| Pakistan, Yemen, Iraq, Syria, and Afghanistan rank among the bottom five. |
Source: Henley Passport Index 2025
3. DIRECT TAX COLLECTIONS FOR F.Y. 2024-25
|
(₹ in Crore)
|
|
FY 2023-24 (as on 10th February, 2024) |
|
Corporate
Tax (CT) |
Non*- Corporate
Tax (NCT) |
Securities Transaction
Tax (STT) |
Other taxes (OT) |
Total |
| Gross Collection |
8,74,561 |
9,30,364 |
29,808 |
3,461 |
18,38,194 |
| Refunds |
1,41,132 |
1,46,321 |
– |
78 |
2,87,531 |
| Net Collection |
7,33,429 |
7,84,042 |
29,808 |
3,384 |
15,50,663 |
|
(₹ in Crore)
|
|
FY 2024-25 (as on 10th February, 2025) |
Percentage growth |
|
Corporate
Tax (CT)
|
Non*-Corporate
Tax (NCT) |
Securities Transaction
Tax (STT) |
Other taxes (OT) |
Total |
Total Growth |
| Gross Collection |
10,08,207 |
11,28,040 |
49,201 |
3,059 |
21,88,508 |
19.06% |
| Refunds |
2,29,731 |
1,80,317 |
– |
57 |
4,10,105 |
42.63% |
| Net Collection |
7,78,475 |
9,47,723 |
49,201 |
3,003 |
17,78,402 |
14.69% |
Source: Central Board of Direct taxes
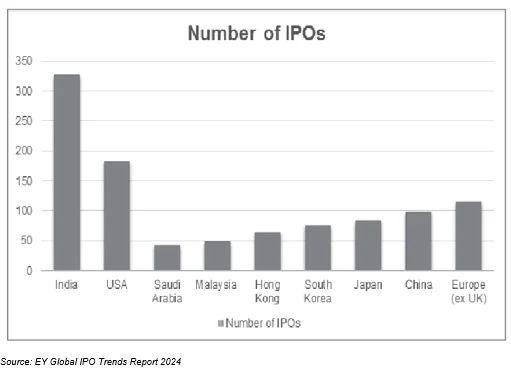
4. COUNTRIES WITH THE MOST IPOS IN 2024
5. GROWTH IN ELECTRONIC EXPORTS
1. Rise In Resident Millionaires’ Population By Country
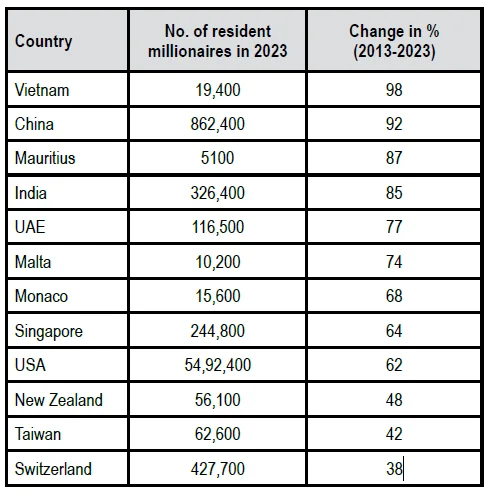
Source: Henley Private Wealth Migration Report 2024
2. India’s Import And Export Trade With The World (In INR Billion)
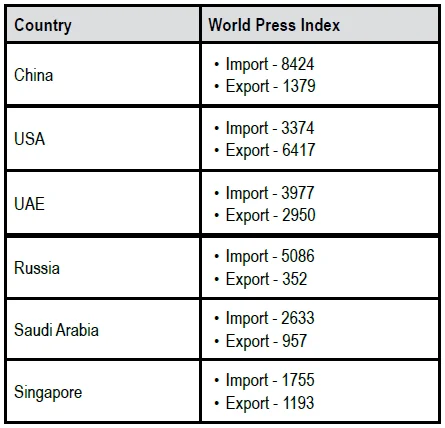
Source: Department of Commerce
3. India — A Key Contributor to Global Migration
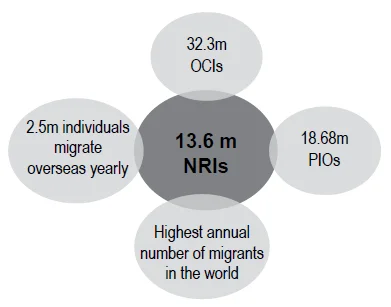
Source: OECD Economic Outlook
4. Rise in Electronic Manufacturing in India
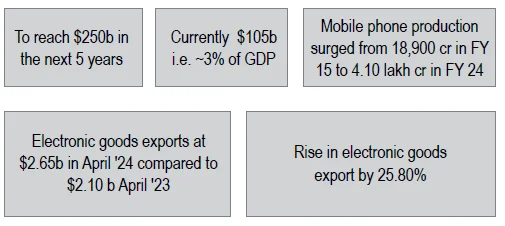
Source: India Cellular and Electronics Association (ICEA)
5. Countries that own the most gold
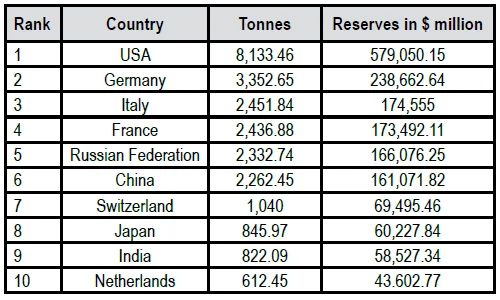
Source: World Gold Council (as on Q1 of 2024)
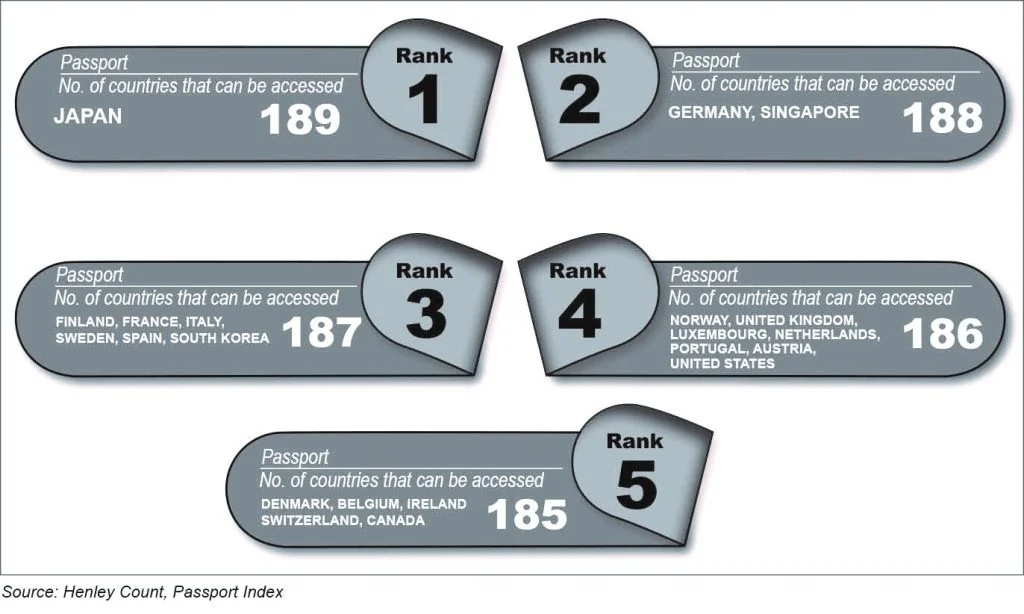
- World’s most powerful passports:
- Online videos gaining edge in India
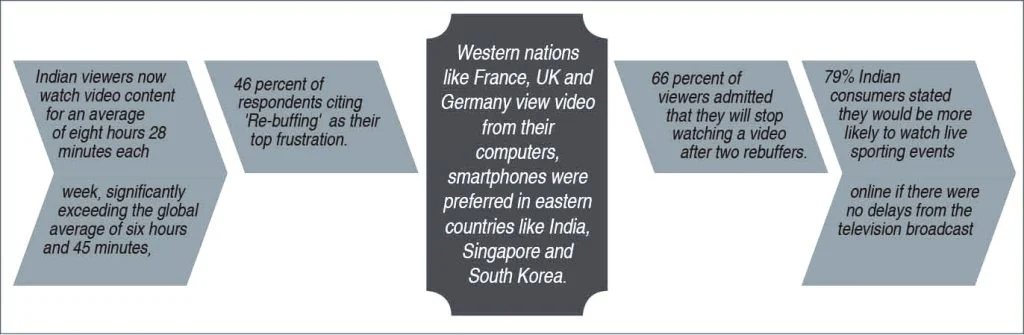
Source: State of Online Video 2018’ report by Limelight Networks.
- Foreign Exchange Reserves (in $ billion):
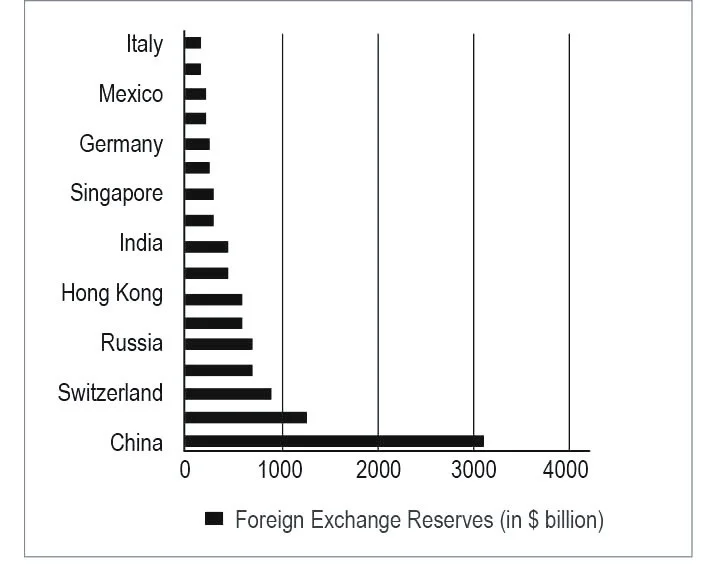
Source: Twitter @spectatorindex
- Self-employed workers as share of total workers
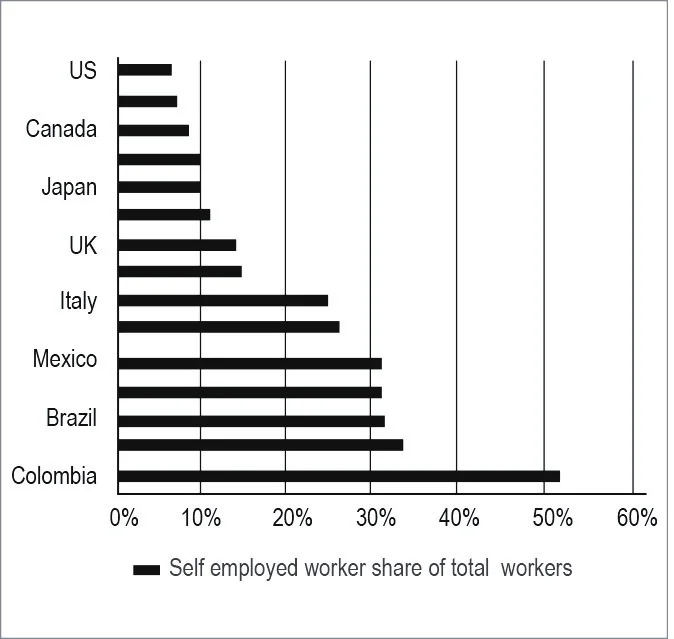
Source: OECD (twitted by @spectatorindex)
- Say media report news accurately, 2018
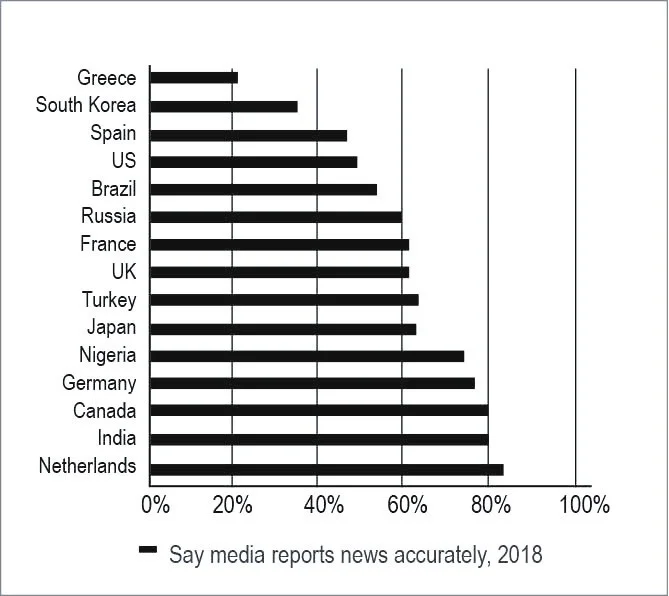
Source: Pew Research (twitted by @spectatorindex)
- Research and Development, 2018 (in $ billion)
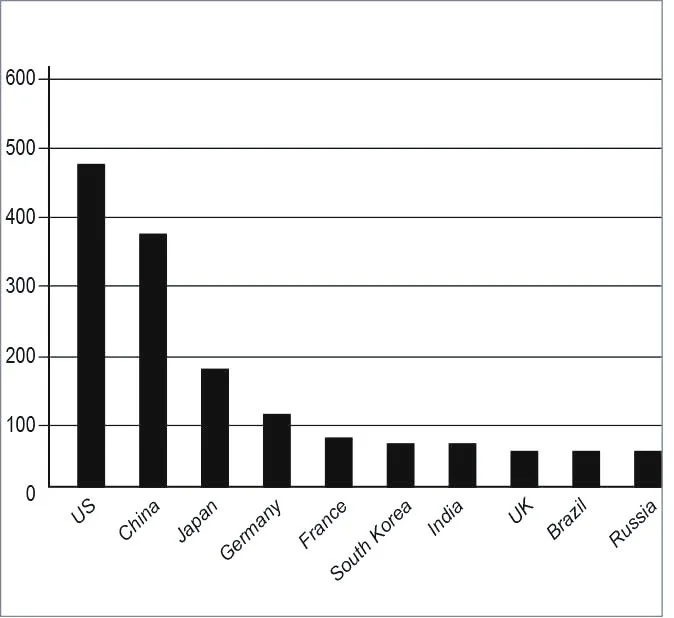
Research and Development, 2018 ( in billion)
Source: UNESCO (twitted by @spectatorindex)
1. Tax return filing before due date:
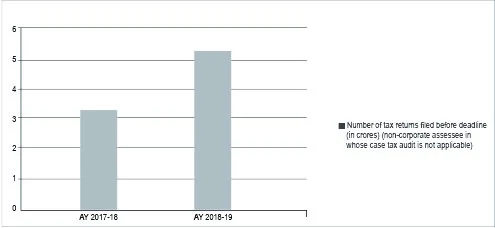
Source: Live Mint
- Stupendous growth in the no. of returns e-filed by persons availing benefit of Presumptive Tax
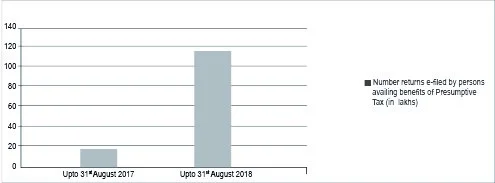
Source: Twitter @IncomeTaxIndia
- Returns e-filed by salaried Individual taxpayers
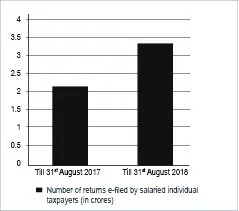
Source: Twitter @IncomeTaxIndia
- The 4G play
Global 4G availability trends
| Circle |
4G availability score |
| Singapore |
86.6% |
| Hong Kong |
90.4% |
| Taipei |
89.8% |
| Kuala Lumpur |
80.8% |
| Yangon |
82.8% |
India’s top 5 circles on 4G LTE availability
| Circle |
4G availability score |
| Kolkata |
90.7% |
| Punjab |
89.8% |
| Bihar |
89.2% |
| MP |
89.1% |
| Odisha |
89.0% |
Source: OpenSignal, UK
- ITAT Litigation Snapshot for August 2018
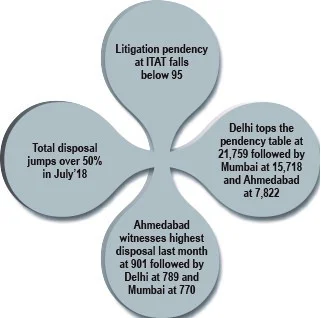
Source: Taxsutra
1. Inflation rate in India from 2012 to 2018

2. Top 10 Fastest Growing cities in the World,
2019-35

3. Budget 2019 – Increase in direct tax
collection

4. Mumbai Roads

5. Commuting time to be included in working
hours

1. Return since 2010:

Source: Twitter@morganhousel
2. Oil exports as a share of GDP, 2018

Source: Twitter @spectatorindex
3. Inflation, 2018

Source: Twitter @spectatorindex
4. Currency against US Dollar, past year

Source: Twitter @spectatorindex
5. Direct and
Indirect Tax Collections
Source: Economic times
6. Samsung smartphone market share in China
(based on shipments)

Source: IDC, Counterpoint
Vital statistics
pertaining to the
“Report of the Comptroller and Auditor General of India for
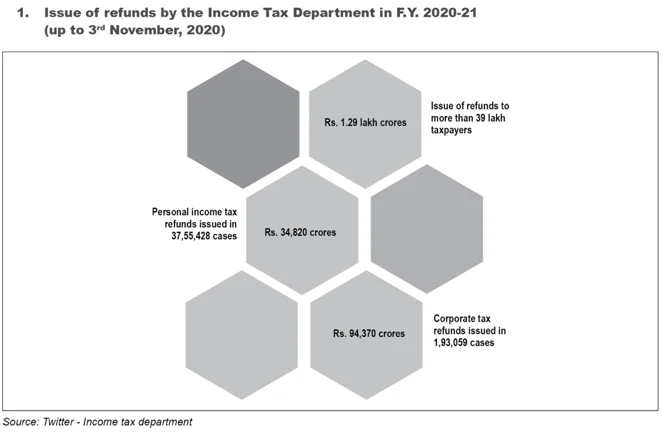
the year ended March 2017” published in 2018 are covered below:
1.
Gross Expenditure by sectors of
General, Social and Economic Services and their autonomous bodies/corporations
|
S.no
|
Name of Ministry
|
2014-15
|
2015-16
|
2016-17
|
|
1.
|
Agriculture
|
26,572.32
|
22,778.34
|
48,997.61
|
|
2.
|
Ayurveda,
Yoga & Naturopathy, Unani, Siddha and Homoeopathy
|
685.19
|
1,112.14
|
1,292.60
|
|
3.
|
Chemicals
and Fertilizers
|
75,411.37
|
77,966.79
|
70,604.54
|
|
4.
|
Civil
Aviation
|
6,626.28
|
4,168.10
|
3,405.79
|
|
5.
|
Coal
|
1,572.50
|
1,669.72
|
1,338.04
|
|
6.
|
Commerce
and Industry
|
7,438.02
|
7,400.47
|
6,507.48
|
|
7.
|
Consumer
Affairs, Food and Public Distribution
|
1,29,663.57
|
1,62,384.89
|
1,47,333.84
|
|
8.
|
Corporate
Affairs
|
226.23
|
404.48
|
397.28
|
|
9.
|
Culture
|
2,069.19
|
2,011.83
|
2,302.55
|
|
10.
|
Development
of North Eastern Region
|
1,761.01
|
2,036.68
|
2,543.61
|
2. Delays in submission of
accounts by central autonomous bodies

2.
Status of laying of the audited
accounts in the Parliament
|
Year of account
|
Total number of bodies for which audited accounts
were issued but not presented to Parliament
|
Total number of audited accounts presented after
due date
|
|
2013-14
|
01
|
Nil
|
|
2014-15
|
01
|
04
|
|
2015-16
|
39
|
62
|
|
|
|
|
4. Utilisation Certificates
Outstanding as on 31 March 2017
As per the General Financial Rules,
certificates of utilisation in respect of grants released to statutory
bodies/organisations are required to be furnished within 12 months from the
closure of the financial year by the bodies/organisations concerned. The
position of outstanding utilisation certificates with significant money value
relating to 10 Ministries/Departments as of March 2017 is given in the table
below:

5. Flow of funds held in
Central Fund during 2012-13 to 2016-17
Audit examination of Central Fund of EIC at
EIA, Kolkata revealed that huge funds were lying idle for years together in the
savings bank account without any effort to ensure their prudent utilisation.
The year-wise position of inflow and outflow of funds held in the Central Fund
during the last five years ended 2016-17 is shown in Graph below:

1. Pendency
of time-barring e-assessments
|
Jurisdiction
|
Pending %
|
|
Delhi
|
92
|
|
Mumbai
|
89
|
|
Gujarat
|
87
|
|
Madhya Pradesh and Chhattisgarh
|
87
|
|
Pune
|
84
|
Source: Income Tax
Department – MIS Report
2. Ease of doing business
|
Particulars
|
Score
2019
|
Score 2020
|
Rank 2019
|
Rank
2020
|
|
Starting a business
|
81
|
81.6
|
137
|
136
|
|
Dealing with construction permits
|
72.1
|
78.7
|
52
|
27
|
|
Getting electricity
|
89.2
|
89.4
|
24
|
22
|
|
Registering property
|
47.9
|
47.6
|
166
|
154
|
|
Getting credit
|
80.0
|
80.0
|
22
|
25
|
|
Protecting minority investors
|
80.0
|
80.0
|
7
|
13
|
|
Paying taxes
|
65.4
|
67.6
|
121
|
115
|
|
Trading across borders
|
77.5
|
82.5
|
80
|
68
|
|
Enforcing contracts
|
41.2
|
41.2
|
163
|
163
|
|
Resolving insolvency
|
40.8
|
62.0
|
108
|
52
|
|
Overall
|
67.5
|
71.0
|
77
|
63
|
Source: World Bank
3. GDP Growth 2019
|
Country
|
GDP growth %
|
|
India
|
7.3%
|
|
China
|
6.3%
|
|
Indonesia
|
5.2%
|
|
Pakistan
|
2.9%
|
|
US
|
2.3%
|
|
Brazil
|
2.1%
|
|
Spain
|
2.1%
|
|
Nigeria
|
2.1%
|
|
Netherlands
|
1.8%
|
|
Saudi
|
1.8%
|
|
Russia
|
1.6%
|
|
Canada
|
1.5%
|
|
France
|
1.3%
|
|
UK
|
1.2%
|
|
South Africa
|
1.2%
|
|
Germany
|
0.8%
|
|
Italy
|
0.1%
|
|
Japan
|
1%
|
|
Turkey
|
-2.5%
|
|
Iran
|
-6%
|
Source: IndiaStatistics
twitter – IMF
4. Highlights of e-filing

Source: Income Tax India
e-filing website
5. ITR filing growth between previous FY and
current FY

Source: Income Tax India
e-filing website
6. Share of informal employment
in total employment (%)

Source: International Labour
Organisation
1. The average cost of 1GB of mobile data in 2019
|
Country
|
Average Cost
|
|
India
|
$0.2
|
|
Russia
|
$0.9
|
|
Malaysia
|
$1.1
|
|
Pakistan
|
$1.8
|
|
Nigeria
|
$2.2
|
|
Brazil
|
$3.5
|
|
Spain
|
$3.7
|
|
UK
|
$6.6
|
|
Germany
|
$6.9
|
|
China
|
$9.8
|
|
Canada
|
$12
|
|
US
|
$12.3
|
|
South Korea
|
$15.1
|
|
Switzerland
|
$20.2
|
Source: cable.co.uk
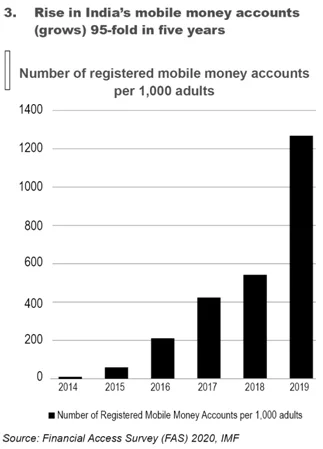
2. Four-fold surge in online payments in rural and semi-urban India
|
Particulars
|
2014
|
2015
|
2016
|
2017
|
2018
|
|
Transactions*
|
4.57
|
10.10
|
13.72
|
17.37
|
17.38
|
|
Value**
|
1,558.1
|
3,717.3
|
7,120.6
|
23,795.5
|
28,243.2
|
|
Electricity Bills
|
|
Transactions*
|
0.24
|
0.32
|
0.49
|
0.56
|
1.00
|
|
Value**
|
108.7
|
138.7
|
239.5
|
308.4
|
1,198.4
|
|
Insurance Premiums
|
|
Transactions*
|
0.02
|
0.04
|
0.08
|
0.11
|
0.17
|
|
Value**
|
2.1
|
9.1
|
23.9
|
48.7
|
77.3
|
*Crore; **Rs. In crores
Source: Common services
centres data
3. Market size of the music industry across India (in billion rupees)

Source: Statista 2019
4. Retail inflation eases marginally

Source: Economic Times
5. Electricity Consumption
(in kWh per capita)

Source: The Spectator Index
6. GST Returns filing summary for financial year 2019-20

Source:
www.gstcouncil.gov.in
7. Only 15% of taxpayers have filed GST returns (as of 9th August,
2019)

Source: ET Online Aug 9,
2019; at 11.12 am IST
1. Category and Income Range wise filing count for current financial year (Updated till October 2018)
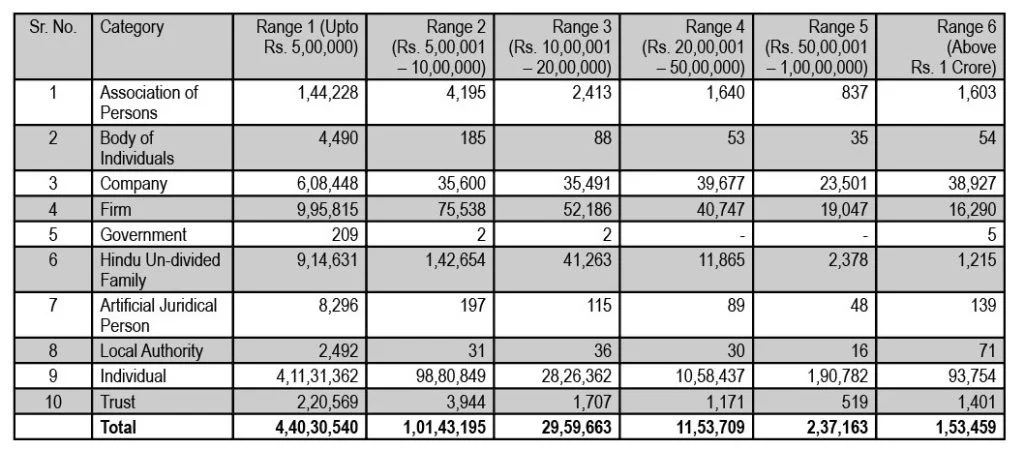
Source: www.incometaxindiaefiling.gov.in
2. State wise filing count for the current Financial Year

Source: www.incometaxindiaefiling.gov.in
Note: States considered above are the one in which more than 5,00,000 returns have been filed during the period 1st April 2018 to 31st October 2018.
3. ITR wise receipt of e-Return (October 2018)
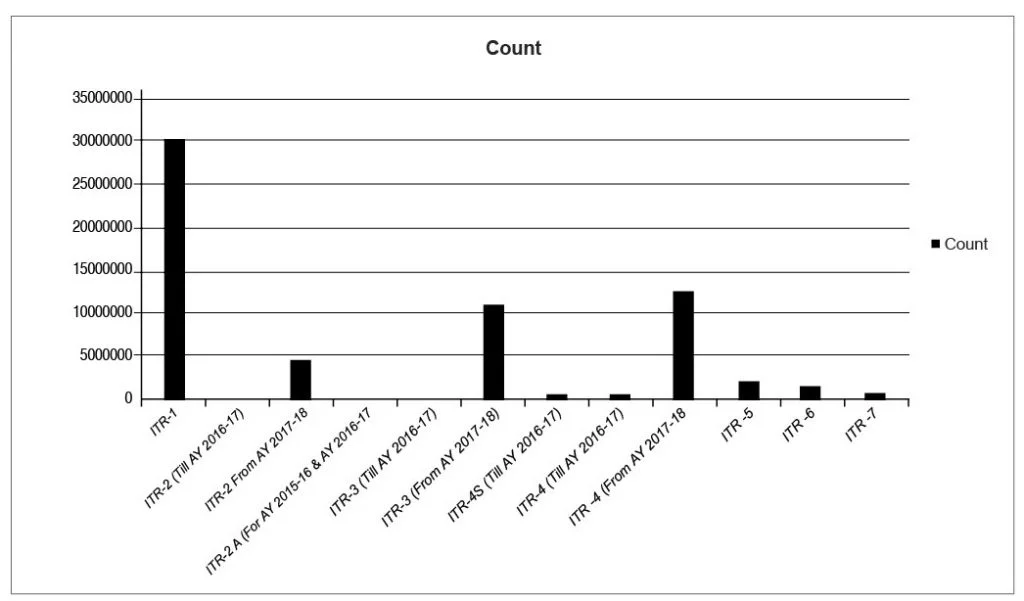 Source: www.incometaxindiaefiling.gov.in
4. Highlights of e-Filing
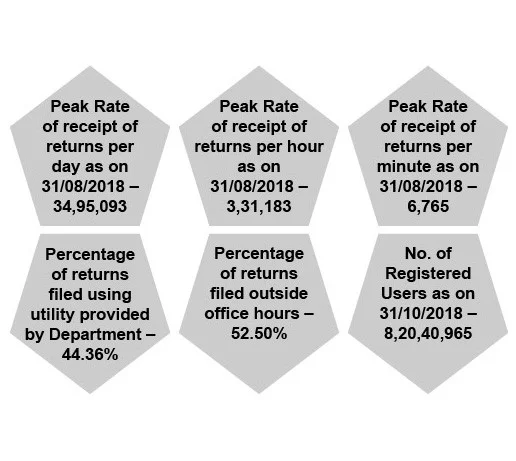 Source: www.incometaxindiaefiling.gov.in
5. Cash growth during Diwali week highest ever
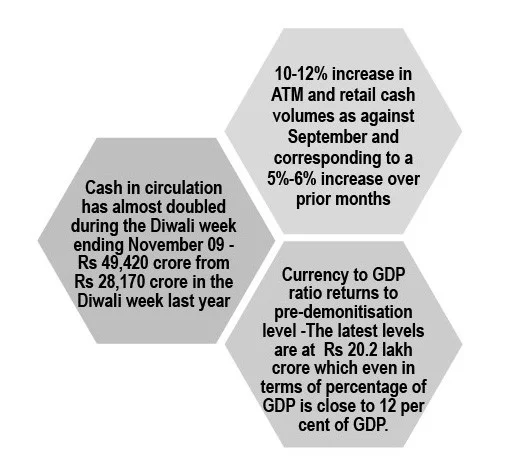 Source: Economic times
1. A. Direct tax collection up to 2017-2018
B. Direct tax collection for 2018-2019
3. Pre-Assessment and Post-Assessment collections
4. Cost of Collection
5. Drop in income tax e-filings
1. Key
India Fdi Sources In Top 10
Jurisdictions (April 2000 to September 2019)

Source: Economic Times
2. Big payouts
declared in February, 2020 post the Finance Bill, 2020 which proposes to
abolish Dividend Distribution Tax (DDT)

Source: Capitaline
3. Stock movements between 12th
February and 12th March, 2020

Source: The Spectator Index
4. Operational
airports

Source: Airport Authority
5. Financial
Secrecy Index 2020
|
Jurisdiction
|
Secrecy Score
|
FDI rank*
|
FDI inflows in crores (Rs.) #
|
|
Cayman Islands
|
76
|
11
|
32,617
|
|
US
|
63
|
5
|
1,61,399
|
|
Switzerland
|
74
|
12
|
26,806
|
|
Hong Kong
|
66
|
13
|
25,041
|
|
Singapore
|
65
|
2
|
5,61,933
|
|
Luxembourg
|
55
|
16
|
17,768
|
|
Japan
|
63
|
3
|
1,85,787
|
|
The
Netherlands
|
67
|
4
|
1,78,365
|
|
British Virgin Islands
|
71
|
22
|
8,727
|
|
UAE
|
78
|
10
|
40,455
|
*ranked on secrecy score plus share in global
financial
services market
# April, 2000 to September, 2019
Source: Economic
Times, 20th February 2020 and Tax justice Network
1. Cities where libraries are
thriving

Source:
World Cities Culture Forum
2. Countries with biggest decrease of carbon emission (in million
tonnes – 2015 compared with 2000)

Source: US Energy
Information Administration
3. Indian APA report for 2018-19

Source: CBDT’s third APA
Annual Report (2018-19)
4. Changing trend in boards of
companies

Source: nseinfobase.com
5. Increase in resignations of
independent directors

Source: nseinfobase.com
1. The biggest private corona virus donations

Source: Forbes
2. Value
of COVID-19 fiscal stimulus packages in G20 countries, as a share of GDP (as of
May, 2020)

Source: Statista
3. Majority
of Bitcoin and crypto owners are open to taxation

Source: Survey by CHILDLY
(crypto finance start-up)
4. Countries
with highest share of health-related goods from China (2017)

Source: UN COMTRADE data
extracted from Observatory of Economic Complexity
5. Countries
with highest export surplus in health-related goods (in billion USD in 2017)

Source: UN COMTRADE data
extracted from Observatory of Economic Complexity
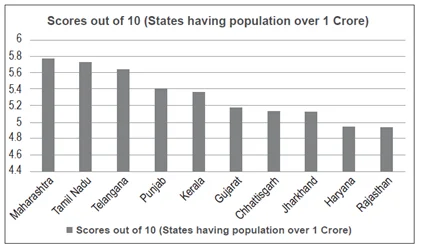
1. Maharashtra
ranks 1st in justice delivery
Source: Times of India
Website
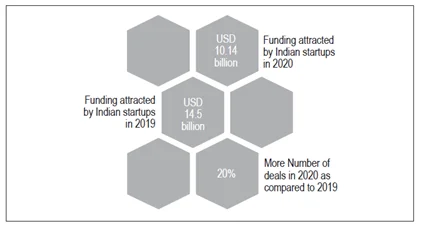
2. Indian
startups attract $10.14 billion funding in 2020
Source: Financial
Express Website
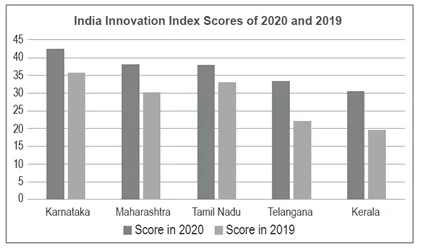
3. Karnataka
tops India Innovation Index 2020
Source: Times of India
Website
4. Most
Innovative economies in the world
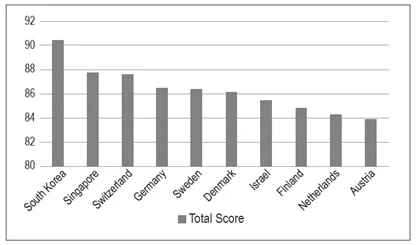
The index takes into account R&D
intensity, value-added manufacturing, productivity, high tech density, tertiary
efficiency, patent activity and researcher concentration
Source: Bloomberg 2021
Innovation Index
5. Equalisation
levy Collections
* The figures for the
year 2020-2021 are up to 31st January, 2021
Source: Ministry of Commerce and Industry
1. Record exports of USD 197.89 billion by India in the first half of F.Y. 2022

2. Rise of Cryptocurrency in millennials

3. India second in Unicorn race in Q3

4. India jumps two places to rank 46 on Global Innovation Index (GII)
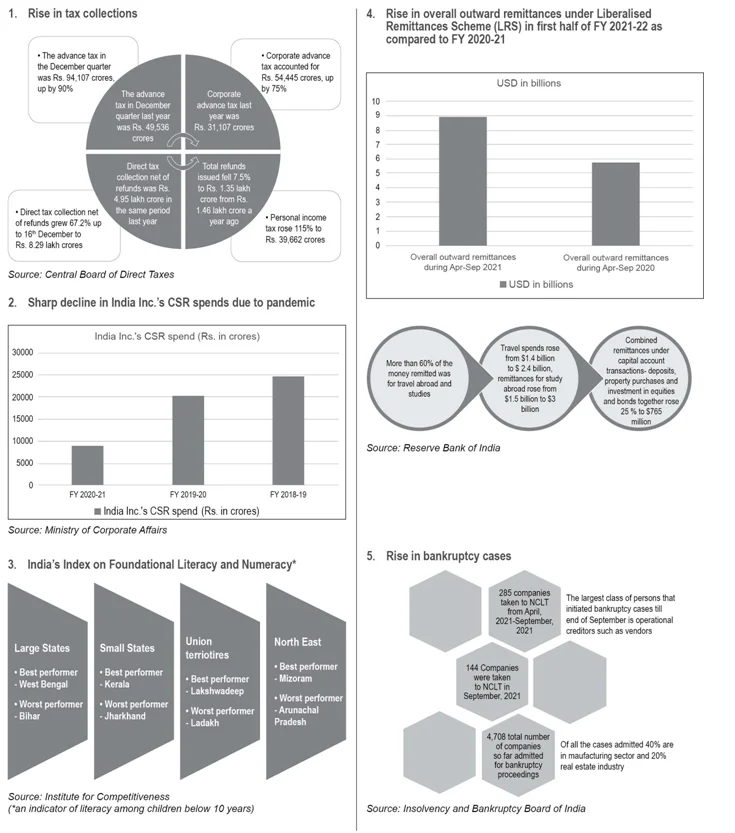
1. TIME TAKEN FOR PROCESSING INCOME-TAX RETURNS HAS SIGNIFICANTLY REDUCED
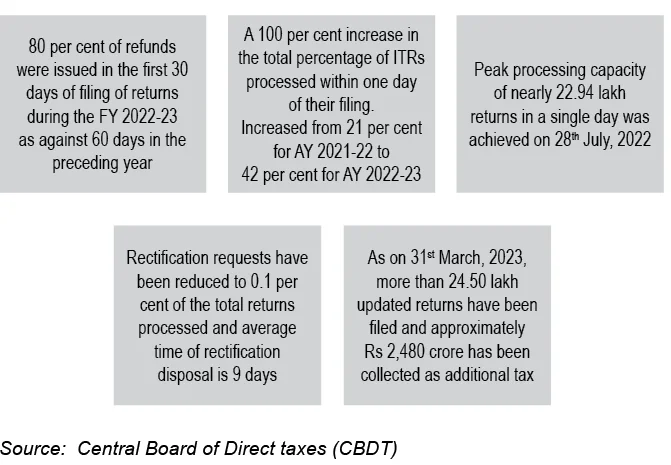
2. NCLT APPROVALS ON PEAK
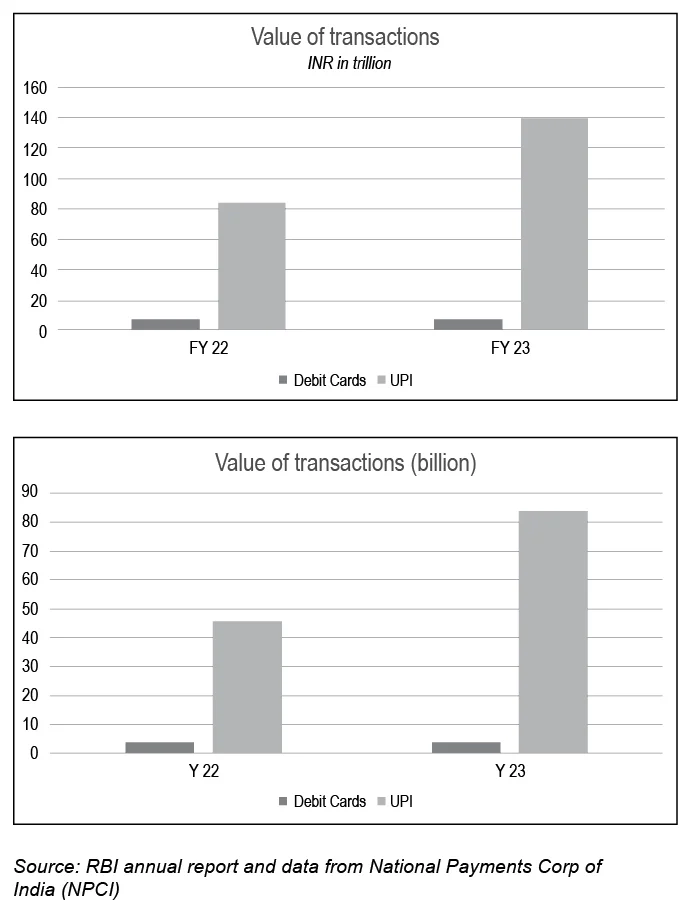
3. UPI TRANSACTIONS ON A RISE
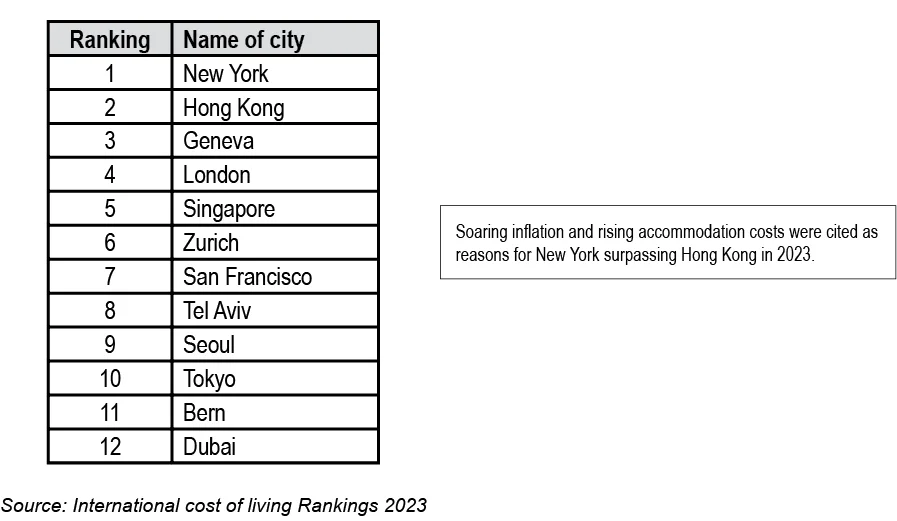
4. MOST EXPENSIVE CITIES FOR EXPATS
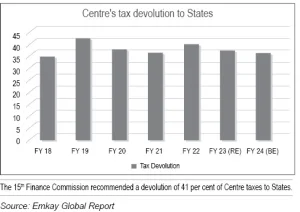
REDUCTION IN TAX DEVOLUTION
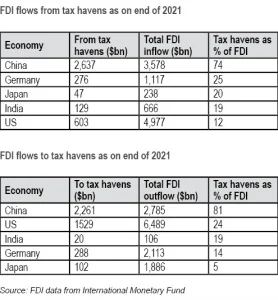
CAPITAL FLOWS THROUGH OFFSHORE FINANCIAL CENTRES
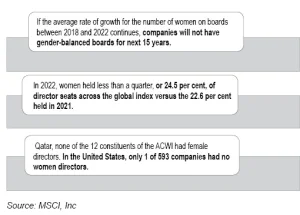
GENDER-EQUAL BOARDS OUT OF REACH UNTIL 2038
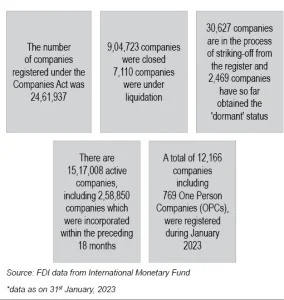
1. More than 12,000 companies registered in January 2023
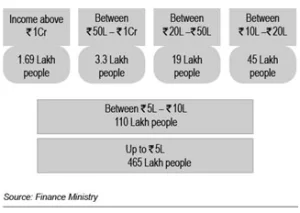
1. NUMBER OF TAX FILERS IN EACH BRACKET FOR FY 2023
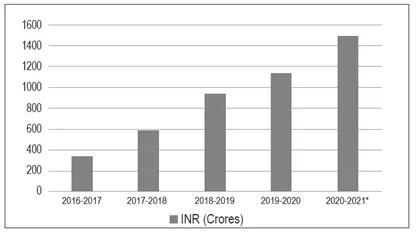
2. DIRECT TAX COLLECTIONS FOR FY 2023–24*
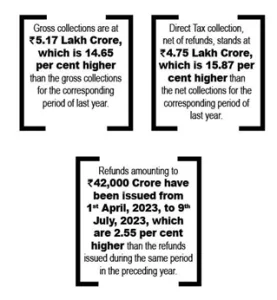
*Data upto 9th July, 2023
Source: Central Board Direct Taxes
3. ESTIMATED TOTAL POPULATION OF INDIA IN 2028 (IN MILLIONS)
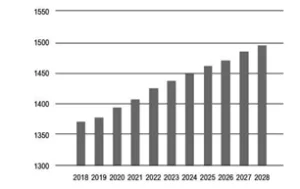
Source: Statista, 2023
4. WORLD’S MOST CHARITABLE PERSONS IN THE LAST CENTURY
|
Ranking
|
Name
|
Amount Donated
|
|
1
|
Jamsetji Nusserwanji Tata
|
USD 102.4 billion
|
|
2
|
Bill Gates and Melinda
|
USD 74.6 billion
|
|
3
|
Warren Buffet
|
USD 37.4 billion
|
|
4
|
George Soros
|
USD 34.8 billion
|
|
5
|
John D Rockefeller
|
USD 26.8 billion
|
Source: EdelGive Foundation and Hurun Report
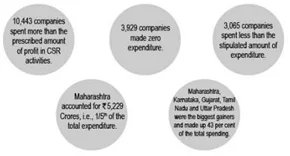
5. INCREASE IN CORPORATE SOCIAL RESPONSIBILITY SPENDS
(Rs in Cr)
|
Sectors
|
FY20
|
FY21
|
FY22
|
|
Health
|
6,841
|
9,276
|
9,987
|
|
Education
|
9,635
|
8,559
|
8,382
|
|
Environment
|
1,805
|
1,337
|
2,837
|
|
Rural
Growth
|
2,301
|
1,851
|
1,801
|
|
Total
Spending
|
24,966
|
26,211
|
25,933
|
Source: Ministry of Corporate Affairs