


INDIA HAS SUCCESSFULLY BUILT CAPACITY, MUST NOW FOCUS ON QUALITY AND ENROLMENT
The Indian higher education system is, by far, among the largest in the world today. The latest available data from AISHE (All India Survey on Higher Education, Ministry of Education) for the academic year 2021-22 shows that 4.32 crore students are enrolled in the system, growing at a 4 per cent CAGR over ten years from 2.91 crore in 2011-12. There are 58,643 active institutions, including 1,168 universities, 45,473 colleges, and the remaining are stand-alone institutions. The total number of institutions has grown at a 2.3 per cent CAGR over ten years, indicating a significant increase in capacity. The Indian HE Gross Enrolment Ratio (GER) stands at 28.4, meaning that 28.4 per cent of the eligible 18-23-year-old population is enrolled in higher education.
| Growth Parameter | 2011-12 | 2021-22 | 10-yr CAGR | 2030-31 (Projected) | 2030-31 (Accelerated) |
| Enrolment | 2,91,84,331 | 4,32,68,181 | 4.0% | 6,16,71,661 | 7,00,90,500
(at 5.51% CAGR) |
| Number of Institutions | 46,651 | 58,643 | 2.3% | 72,050 | – |
| Number of Universities | 642 | 1,168 | 6.2% | 2,002 | – |
| Number of Colleges | 34,852 | 45,473 | 2.7% | 57,773 | – |
| 18-23 Year Population | 14,03,17,069 | 15,24,52,016 | – | 14,01,81,000 | 14,01,81,000 |
| GER | 20.8 | 28.4 | – | 44.0 | 50.0 |
Table 1: Trend analysis of certain growth parameters in the Indian HE system with projections to 2031. Data from AISHE and Population Projection Report 2011-2036, projections computed by authors.
Projected enrolment growth at a 4 per cent CAGR suggests that student numbers will surpass 6 crore by 2030-31. According to India’s Population Projection Report 2011-2036, the population aged 18-23 will be just over 14 crore at that time, leading to a GER of 44. NEP 2020, FICCI, and other stakeholders have set an ambitious GER target of 50 for 2030. To reach an enrolment of 7 crore, which is 50 per cent of 14 crore, enrolment must increase at a 5.5 per cent CAGR from the current 4 per cent . With institutional capacity already sufficient, the focus must shift from expanding quantity to enhancing quality to improve the educational standards.
Gender parity in Indian higher education was achieved in 2019-20 and remains above 1. More women are entering higher education with greater aspirations. The 10-year enrolment CAGR for women is 4.7 per cent , compared to 3.4 per cent for men. In 2021-22, women constituted 48 per cent of total enrolment, up from 44.6 per cent ten years earlier. Women’s GER stands at 28.5, slightly higher than men’s at 28.3, and has grown more rapidly, from 19.4 in 2011-12 compared to 22.1 for men. This indicates that a growing number of women aged 18-23 view higher education as a pathway to a better quality of life. This positive trend points towards a significant increase in the qualified workforce. To fully leverage this, quality employment opportunities must be developed nationwide, enabling educated women to join the workforce near their homes and communities.
| Enrolment | 2011-12 | 2021-22 | 10yr CAGR |
| Total | 2,91,84,331 | 4,32,68,181 | 4.0% |
| Male | 1,61,73,473 | 2,25,76,389 | 3.4% |
| Female | 1,30,10,858 | 2,06,91,792 | 4.7% |
| Female % | 44.6% | 47.8% | – |
| Enrolment | 2011-12 | 2021-22 | 10yr CAGR |
| Total GER | 20.8 | 28.4 | – |
| Male | 22.1 | 28.3 | |
| Female | 19.4 | 28.5 | |
| Gender Parity Index | 0.88 | 1.01 |
Table 2: Higher education enrolment across male and female categories. Data from AISHE
SPECIALISATION AND DOMAIN EXPERTISE
Growing economies need expertise across all domains — science and technology, finance and commerce, culture and arts, education, healthcare and doctors, law, business administration, and so on.
Total number of graduates in 2021-22 exceeded 1 crore. Of these, the top fields studied by number are Bachelors degrees in Arts, Science, Commerce, Technology and Engineering, and Education. While the 5-year CAGR of total enrolment is 3.92 per cent, the CAGRs of these five top fields are 3.53 per cent, 1.46 per cent, 1.7 per cent, -1.21 per cent and 12.68 per cent. The negative trend in B.Tech + B.E. enrollment is disheartening at a time when technology has become ubiquitous in our daily lives and India needs more STEM graduates to drive R&D, intellectual property, and technological production. M.B.B.S enrolment is growing 8.7 per cent CAGR; an encouraging trend given the dearth of qualified medical personnel in the country. The Central Government’s push to increase institutional capacity in medical sciences is clearly working and more can be undertaken in this direction to respond to India’s medical and healthcare needs.
| Graduates | Total | B.A.
(+ Hons) |
B.Sc.
(+ Hons) |
B.Com. | B.Tech. | B.Ed. | M.B.B.S. | Others |
| 2021-22 | 1,07,38,573 | 28,19,421 | 13,89,106 | 11,07,966 | 8,46,613 | 6,63,862 | 54,547 | 38,57,058 |
| Enrolment | ||||||||
| 2016-17 | 3,57,05,905 | 1,12,36,658 | 52,23,984 | 39,91,742 | 40,85,759 | 8,37,264 | 2,11,366 | 1,01,19,132 |
| 2021-22 | 4,32,68,181 | 1,33,67,637 | 56,17,138 | 43,41,916 | 38,45,332 | 15,20,715 | 3,20,149 | 1,42,55,294 |
| 5-yr CAGR | 3.92% | 3.53% | 1.46% | 1.70% | -1.21% | 12.68% | 8.66% | 7.09% |
Table 3: Enrolment and graduates in top undergraduate HE fields studied. Data from AISHE
Specialisation is crucial for a growing economy. It enables productivity improvements in society, an increase in innovation, and the ability to produce world-class products and services domestically to, both meet our growing needs and capture global markets. Specialisation can be directly measured by the number of PhD and post-graduates. 2 lakh+ students were enrolled in PhD programs in 2021-22, having grown from 80,452 in 2011-12 at 10.2 per cent CAGR. PhD graduates have grown from 21,544 to 65,176 in the same period. Post graduate enrolment has increased from 27.9 lakh to 51 lakh in the same period, whereas PG graduates from 11 lakh to 35.5 lakh. While these numbers are encouraging, India must produce many more PhDs and PGs for a country with 1.44Bn population.
Table 4 gives a snapshot of some important fields of specialisation pursued by PhD and PG students. India needs more quality researchers with PhDs to lead research and innovation efforts across several disciplines. Agriculture innovation will be an essential factor in India’s reorganisation of sectoral workforces; commerce, in India’s financial infrastructure development strategies; education, in determining new ways to educate, upskill, and enable continuous learning; medical sciences, as we re-engineer our healthcare delivery; Scientific and technological development, and others. The low number in I.T. and Computers is troubling; with the world’s advancements in artificial intelligence, machine learning, quantum computing, data analytics, and others related to I.T. and Computers, India must be more aggressive in this field.
India must study domestic and global scenarios to understand domains that will be valuable going forward and invest in building competencies there. China has set a great example in the realm of quantum computing and artificial intelligence. With in-depth investment strategies and incentives for their top talent, China is surpassing even the United States in this field. If India doesn’t start investing in domain expertise, we risk being left behind in the new world.
| Field | PhD | Post Graduates | ||
| Enrolled | Graduated | Enrolled | Graduated | |
| Agriculture | 7,153 | 1,667 | 35,783 | 12,728 |
| Commerce | 7,112 | 1,058 | 5,18,631 | 1,89.765 |
| Education | 6,669 | 771 | 2,72,120 | 84,802 |
| Engineering/Tech | 52,748 | 6,270 | 1,73,950 | 62,178 |
| IT and Computers | 4,187 | 621 | 2,29,456 | 72,774 |
| Medical Sciences | 15,081 | 2,073 | 2,48,171 | 71,936 |
| Science | 45,324 | 7,408 | 7,52,807 | 26,402 |
| Total | 2,12,474 | 65,176 | 51,19,865 | 35,51,676 |
Table 4: PhD and post graduate scholars in select fields in 2021-22. Data from AISHE
AFFIRMATIVE ACTION HAS YIELDED RESULTS
Towards the objectives of inclusive enrolment and coverage, affirmative action has undoubtedly yielded results. Between 2012-13 and 2021-22, enrolment among various groups increased at astounding 9-year CAGRs – by 6.2 per cent (SC), 8.3 per cent (ST), 6.3 per cent (OBC), 6 per cent (Muslims) and 5.4 per cent (other minorities), all well over the average of 4 per cent. General enrolment is stagnating at 0.7 per cent. The Government’s focus on HE has enabled rapid development of previously deemed disadvantaged classes.
| Community | Enrolment (lakh) | Population % | HE Enrolment
9-yr CAGR |
||
| 2012-13 | 2021-22 | 2021-22 (%) | Census 2011 | ||
| SC | 38.48 | 66.23 | 15.3% | 16.6% | 6.2% |
| ST | 13.2 | 27.11 | 6.3% | 8.6% | 8.3% |
| OBC | 94.16 | 163.36 | 37.8% | 40.9%* | 6.3% |
| Muslims | 12.52 | 21.08 | 4.9% | 14.2% | 6.0% |
| Other Minorities | 5.64 | 9.05 | 2.1% | 6.0% | 5.4% |
| General | 137.52 | 145.85 | 33.6% | 13.6% | 0.7% |
| All | 301.52 | 432.62 | 100.0% | 100.0% | 4.1% |
Table 5A: Population data from Census 2011, * from NSSO, HE data from AISHE
Enrolment proportions for the SC, ST and OBC communities in 2021-22 are close to their population composition –
For the SC community, 15.3 per cent enrolment against 16.6 per cent of the population; remarkably close
For the ST community, 6.3 per cent enrolment against 8.6 per cent of the population; this, too, is quite close
For the OBC community, 37.8 per cent enrolment against 40.9 per cent of the population; close, as well
Minorities, however, have not demonstrated the same progress. Minorities constitute 20.2 per cent of India’s population but only 7 per cent in HE enrolment. Low Muslim enrollment is a key issue, but the growth rates are impressive.
Disaggregating the social groups’ enrolment data by gender clearly revels Indian women’s aspirations.
Table 2 shows that across groups, women’s enrolment CAGR is ahead of men’s — 7 per cent (W) vs 5.6 per cent (M) among the SC community, 9.6 per cent (W) vs 7.2 per cent (M) among the ST community, and 6.8 per cent (W) vs 5.9 per cent (M) among the OBC community. Though the Muslim community’s representation in higher education is far lesser than its population composition, here too, women’s enrolment CAGR at 6.6 per cent is far higher than men’s at 5.4 per cent. The ‘other minorities’ group is the only one where this reversed — 4.9 per cent (W) vs. 6 per cent (M). In the general category, men’s enrolment has stagnated at 0 per cent CAGR as the enrolment in 2012-13 and 2021-22 is very similar. Women’s enrolment in this group is 1.5 per cent, higher than men’s here as well.
| Community | Male | Female | Total | ||||||
| 2012-13 | 2021-22 | 9-yr CAGR | 2012-13 | 2021-22 | 9-yr CAGR | 2012-13 | 2021-22 | 9-yr CAGR | |
| SC | 21.19 | 34.52 | 5.57% | 17.29 | 31.71 | 6.97% | 38.48 | 66.23 | 6.22% |
| ST | 7.32 | 13.65 | 7.16% | 5.88 | 13.46 | 9.63% | 13.20 | 27.11 | 8.32% |
| OBC | 51.00 | 85.18 | 5.87% | 43.17 | 78.19 | 6.82% | 94.16 | 163.36 | 6.31% |
| Muslims | 6.67 | 10.69 | 5.38% | 5.85 | 10.39 | 6.60% | 12.52 | 21.08 | 5.96% |
| Other Minorities | 2.53 | 4.27 | 6.02% | 3.12 | 4.78 | 4.86% | 5.64 | 9.05 | 5.39% |
| General | 77.47 | 77.46 | 0.00% | 60.05 | 68.39 | 1.46% | 137.52 | 145.85 | 0.66% |
| All | 166.17 | 225.76 | 3.46% | 135.35 | 206.92 | 4.83% | 301.52 | 432.68 | 4.09% |
Table 5B: Gender Split in Enrolment Across Social Categories. Data from AISHE
Overall, social groups are faring well in higher education. Driving enrolment up in key groups and regions across India can be facilitated by expanding the capacity of existing institutions and setting up greenfield institutions in regions with low institutional capacity. Distance education can also be utilised to drive enrolment. The key point here is that increasing the cake will enable more people to partake, rather than slicing the existing cake any thinner.
ONE COMMON POLICY ACROSS INDIA WON’T WORK
India is an incredibly diverse country with high variance across economic indicators — state GDP, per-capita income, fertility and population growth rates, urbanisation, and education and skill development. The education profiles of 14 major states across India are represented in Table 6, showing vastly different institutional capacities, enrolment profiles and pupil-teacher ratios.
| Zones | Enrolment | GER | Graduates | Teachers | Pupil-Teacher Ratio | Number of Institutions | Fertility Rate |
| North-Central | |||||||
| Uttar Pradesh | 69,73,424 | 24.1 | 16,37,026 | 1,78,193 | 36 | 9,660 | 2.4 |
| Rajasthan | 26,89,340 | 28.6 | 7,07,179 | 83,192 | 29 | 4,598 | 2 |
| Madhya Pradesh | 28,00,165 | 28.9 | 7,65,365 | 82,461 | 31 | 3,220 | 2 |
| Punjab | 8,58,744 | 27.4 | 2,37,990 | 50,992 | 17 | 1,451 | 1.6 |
| East | |||||||
| Jharkhand | 8,79,965 | 18.6 | 2,01,517 | 15,089 | 58 | 514 | 2.3 |
| Odisha | 10,73,879 | 22.1 | 2,43,070 | 43,730 | 25 | 1,858 | 1.8 |
| Bihar | 26,22,946 | 17.1 | 4,10,485 | 38,152 | 69 | 1,444 | 3 |
| West Bengal | 27,22,151 | 26.3 | 5,63,911 | 73,817 | 37 | 2,146 | 1.6 |
| South | |||||||
| Tamil Nadu | 33,09,327 | 47 | 9,82,656 | 2,08,736 | 16 | 3,790 | 1.8 |
| Andhra Pradesh | 19,29,159 | 36.5 | 4,77,861 | 1,06,538 | 18 | 3,371 | 1.7 |
| Telangana | 15,96,680 | 40 | 3,56,044 | 84,086 | 18 | 2,573 | 1.8 |
| Karnataka | 24,36,540 | 36.2 | 6,41,072 | 1,50,885 | 16 | 6,220 | 1.7 |
| West | |||||||
| Maharashtra | 45,77,843 | 35.3 | 12,01,050 | 1,67,692 | 27 | 7,003 | 1.7 |
| Gujarat | 17,97,662 | 24 | 4,13,866 | 61,803 | 28 | 2,813 | 1.9 |
| All-India | 4,32,68,181 | 28.4 | 1,07,38,573 | 15,97,688 | 26 | 58,643 | 2 |
Table 6: Snapshot of states’ HE bases in 2021-22. Data from AISHE, NFHS-5
Uttar Pradesh’s higher education base tops the country, by far, in enrolment, number of graduates, and number of institutions. The state accounts for a significant 16 per cent of India’s enrolled students (69.7 lakh of 4.32 crore), 15.2 per cent of graduates (16.3 lakh of 1.07 crore), and 16.5 per cent of HE institutions (9,660 of 58,643). Maharashtra comes next with 10.6 per cent of India’s enrolled students (45.7 lakh of 4.32 crore), 11.2 per cent of graduates (12 lakh of 1.07 crore), and 11.9 per cent of HE institutions (7,003 of 58,643). Tamil Nadu comes in third with 7.6 per cent of India’s enrolled students (33 lakh of 4.32 crore), 9.2 per cent of graduates (9.8 lakh of 1.07 crore), and 6.5 per cent of HE institutions (3,790 of 58,643).
The National Education Policy 2020 recommends the consolidation of fragmented institutions into multidisciplinary universities of 3000+ students (more details on NEP 2020 are below). States with active university systems can quickly grow them into large multidisciplinary universities.
In terms of GER, Tamil Nadu by far leads the country with 47. Apart from Telangana, no other large state has even crossed 40.0 in 2020-21. In general, all southern states including Maharashtra have good GERs much higher than the all-India average of 28.4. GER is calculated as the ratio of the number of enrolled students to the eligible 18-23-year population.
All the states in the north-central-east zones, and Gujarat in the west, have GERs below 30. Rajasthan (28.6) and Madhya Pradesh (28.9) impressively are maintaining GERs above the India average, given their large populations. Uttar Pradesh and Punjab were doing well earlier but seem to have slipped behind after the pandemic. Crucial states like Bihar and Jharkhand have not crossed GER of 20, which is worrisome. Eastern states also have a very low number of institutions, which contributes to low enrolment, and indicates a lack of drive to develop human capital. Immediate planning is required to bring GERs in these states to at least the all-India average of 28.4.
Tamil Nadu leads by teaching staff as well, with 2+ lakh, followed by Uttar Pradesh with 1.78 lakh, Maharashtra with 1.67 lakh, Karnataka with 1.5 lakh, and AP with 1+ lakh. These are the only states with lakh+ teaching staff base in HE. Southern states have impressive average pupil-teacher ratios (PTR) of below 20, led by Karnataka and Tamil Nadu at 16.
On the other end, eastern states like Jharkhand and Bihar have absurdly high PTRs of 58 and 69. Uttar Pradesh comes next at 36, but given the large population and enrolment base, the state is showing promising results compared to other population-dense states like Bihar and Jharkhand. States with moderate PTRs are Odisha (25), Maharashtra (27), Gujarat (28), and Rajasthan (29). Of these, Maharashtra is the only state that has moderate PTR despite having a great teaching base because its enrolment base is also large. The other three — Gujarat, Odisha, and Rajasthan — have moderate PTRs because their enrolment base is lower than average as indicated by low GERs, and their teaching base is also low. Intensive effort to improve both must commence soon.
One common education policy across the country clearly will not work, and each state must formulate a specific policy responding to the needs of its citizens and youth base. In general, states in the north and east have younger, larger populations and must focus on driving enrolment and accessibility to education. States in the south and west have ageing populations, drastically lowered fertility rates, and better enrolment ratios, and can focus largely on improving quality of education and education-industry linkages.
FUTURE OF INDIAN EDUCATION
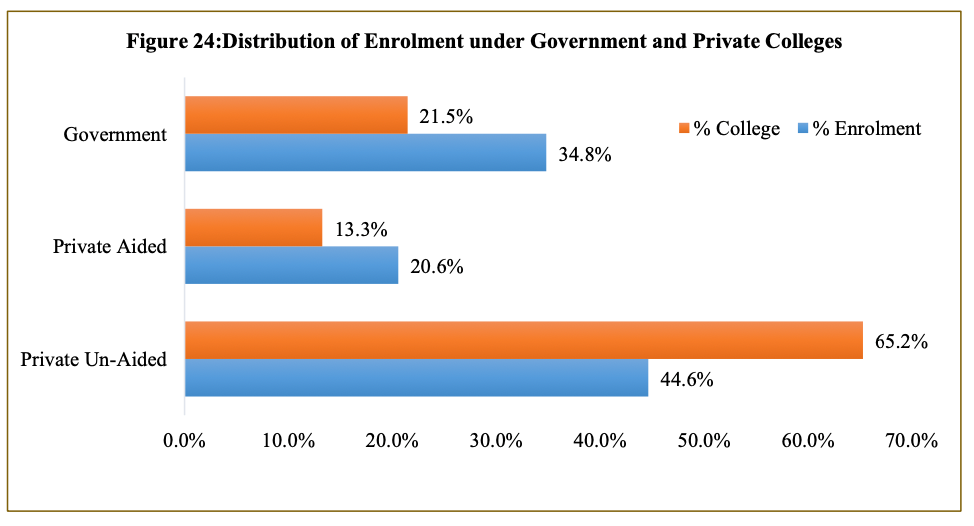
National Education Policy (NEP) 2020 was a transformational framework, enacted 34 years after the previous outdated policy in 1986. The system needs overhaul because it is rife with rigid structures with low flexibility to innovate and respond to today’s needs, an increasing shift to the private sector across all levels of education due to dissatisfaction with government-provided education despite education spending at ₹5-6 lakh crore annually, and rote learning favoured over learning abilities and outcomes. India’s HE system does not prioritise research and innovation and, in general, has been teaching the same curricula for the last twenty years.
Data indicates India is solving the capacity problem of equity and access but must aim to vastly improve quality over the next 20 years. For this, the autonomy of the Top 200 universities, by national ranking, is critical to pursue radical strategies for providing world-class education and ensure greater transfer to public research. Indian universities must also be encouraged to expand overseas and set up campuses in other countries. Today, more than 750,000 students study abroad spending $20Bn+ in fees. Indian universities must be empowered to capture some of that value. Globalisation of Indian education must be supported by both outbound and inbound strategies. NEP 2020 provides a ground-breaking framework and the flexibility to achieve these goals and more:
- Consolidation of the large number of standalone institutions into large multidisciplinary universities and educational clusters will enable superior specialisation and expand domain expertise.
- Multiple certification options like undergraduate, certificate, diploma, etc. will improve accessibility and flexibility of education.
- A central repository like an Academic Bank of Credit will help students who are returning after a hiatus or with continuous learning and upskilling.
- Internationalisation by inviting the Top 100 global universities to open academic centres in India will create a pull-up effect on overall quality of education.
- Expanding open and distance learning, especially with today’s technological tools will radically improve equity of access.
- Changing governance and autonomy structures will break the rigidity and inflexibility and allow for innovation education models.
- A steady research focus that will feed into the country’s science and technological leadership vision must be instituted. Towards this, the proposed National Research Foundation with an ₹50,000 crore outlay over five years will be a tremendous step forward.
Technology can significantly enhance education by making learning more engaging, accessible, and personalised:
- Personalised Learning: Adaptive learning software uses AI-powered tools that adapt to each student’s learning pace and style, providing customised resources and feedback. Learning Management Systems track student progress, provide personalised resources, and facilitate communication between teachers and students.
- Online resources and courses can be incredibly useful. Massive Open Online Courses (MOOCs) from providers like Coursera, edX, and Udacity offer high-quality courses from top global universities. In addition, digital libraries and databases provide access to vast information and research materials online, such as Google Scholar or JSTOR.
- Virtual and Augmented Reality models can create interactive and immersive learning experiences, such as virtual field trips or 3D modelling for science subjects. Similarly, simulation software can provide realistic simulations for training in medicine, engineering, and aviation.
- Artificial Intelligence has a growing influence on education. Chatbots and AI tutors can provide instant help and tutoring outside of classroom hours, assisting with homework and study questions. Educators can use data analytics to analyse student performance data to identify learning gaps and tailor instruction accordingly.
- Interactive learning platforms are applications that turn learning into an engaging experience; leading examples are Duolingo for language learning and Khan Academy for various subjects. Gamification incorporates game-like elements such as points, badges, and leaderboards to motivate students and make learning fun.
- Accessibility can be vastly improved with assistive tools like screen readers, speech-to-text software, and adaptive keyboards that help students with disabilities. Similarly, translation apps enhance access to educational content and classes in other languages.
- Technology also allows for blended learning, such as flipped classrooms and hybrid models that combine online and in-person instruction to provide flexibility and maximise learning opportunities.
- Professional development and upskilling of educators can be undertaken via online workshops and webinars where teachers can continuously improve their skills.
India hosts one of the largest education systems in the world and has successfully established equity and access. These metrics are steadily improving every year. Concurrently, India has succeeded in population-scale socio-economic development over the last decade and has set sights on becoming a Top 3 economy over the next few years. To maintain economic and technological leadership, it is imperative to inculcate a drive towards superior quality education and internationalisation. Increasing institutional autonomy and public funding of research will serve India well.